When you see me trading Emini Nasdaq using Warp predictive software I use the green dots over the 120 EMA as buy signals; It’s called Pattern #1.
The red dots under the 120 EMA are used as sell signals and is called Pattern #2. When you buy the software, you have all these configurations in a Handbook in PDF format.
For today with the setup that I have for my predictive signals, shows me my first buy opportunity at 8:37. At this point you open the first trade (ENTRY 1), this is a Buy P1 pattern, and with 2 contracts or more you can:
- Take profit at the las high first, move your SL at point of break even and,
- Close the second contract or rest of the contracts at 8:51 when the time for that candle in the 1-minute chart ends.
- Or you can close all contacts at 8:51
For the entry number 2 (ENTRY 2 in the chart) I used the crossover EMA 120 technique. You wait until the candle closes under the 120 EMA, open the trade, the stop loss is above 1 tick over the candle, and you take profits at the next timestamp when the time of that candle expires.
For the entry number 3 (ENTRY 3 in the chart) I used the puncture technique. It consists in wait a candle that crosses and close under the green level defined by the 9:03 signal and open a trade short. The stop loss is above the candle 1 tick and you can grab 5 to 8 ticks of that move easily.
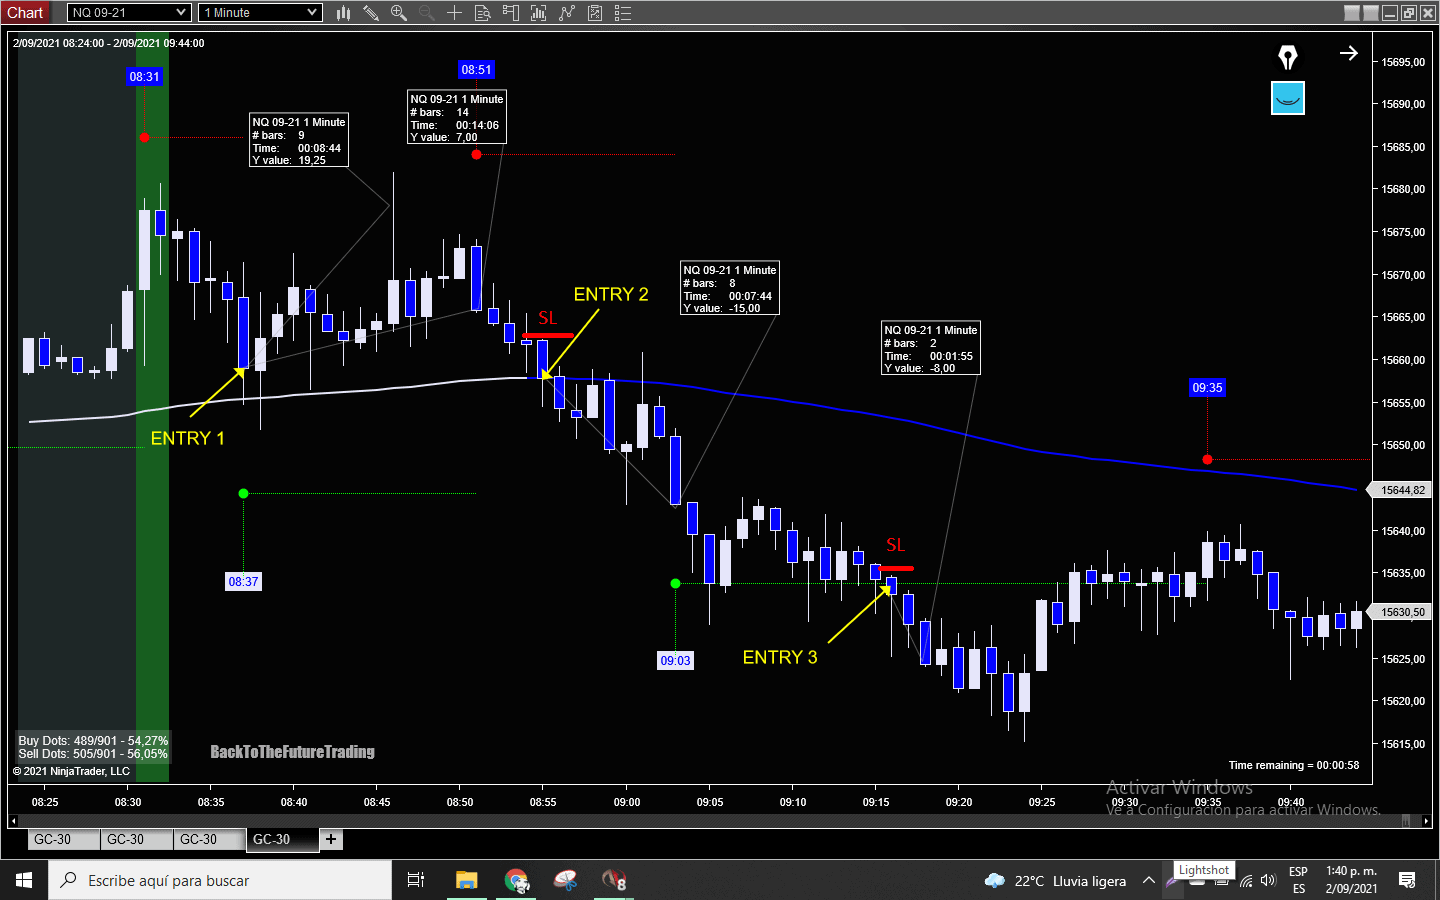
There you have it, Pattern 1, Crossover and puncture Technique for Warp predictive Software and the correct way to manage risk and take profits.
Juan Fernando Vega
Mechanical Engineer
Bogota-Colombia
Spanish – Support
Skype: juanvegam