Once I started trading markets with Flux time cycle indicators and tools, when I started delving into the data and mining it for patterns that were either there or not - and testing their predictability moving forward - I stopped doing something that I was conditioned to do.
I stopped watching the news. Financial papers. TV (especially TV). Econs? Phfsh....
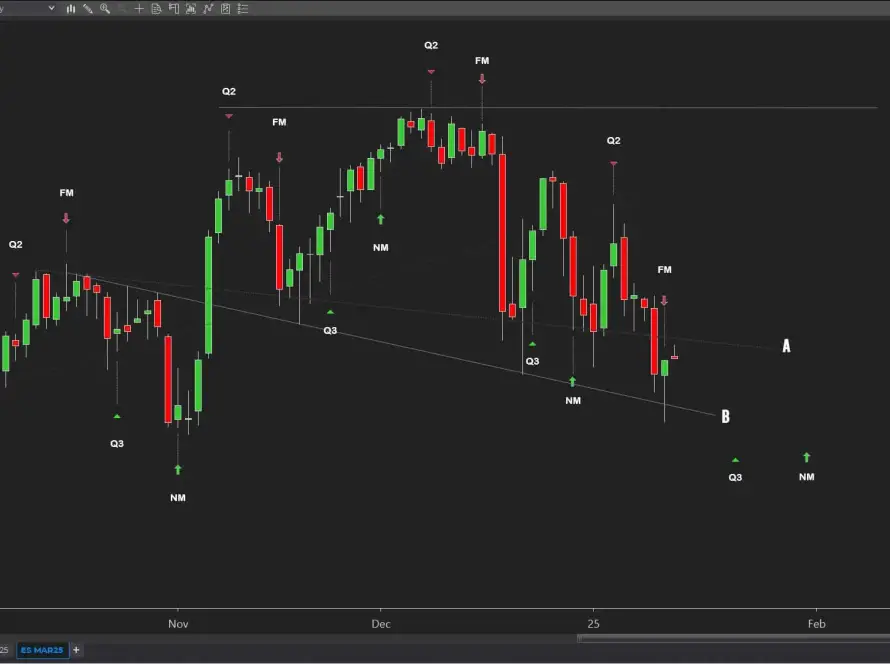
I want you, for a moment, to allow your eyes to scan this photograph:

You know what's most interesting to me?
The fact that the dots - which represent time cycles that were known about 1 week before the actual moves - appear more often than not near actual moves.
When you know these times in advance- you begin as a day trader to anticipate changes in market direction. The time cycles end, and the price cycles end, right about the same time.
You'll see an emini Nasdaq trade above - one that I waited an entire NYSE session to get to.
A lot of setups came and went on my trading charts waiting for it. But as the time cycle approached - I almost watched the exhaustion and turn coming in slow motion. I could "feel" the momentum of the entire market dying, and shifting back downwards. And I was amazed that the time cycle indicator - predictive 1 week out into the future - was showing me the minute - to the minute - when that move should- and did- occur.
So as you look at those dots (non-photo-shopped, I Eagle Scout promise) and you start to see what happened at those times - 1 week before the time cycles were set to actually kick in - ask yourself the same question I asked myself 3 years ago...
"How on earth, is that possible?"
Unless of course - the news....the econs....the widespread "propaganda panic" is all just one giant smoke screen.
Something to consider as a possibility. Until then - keep checking in on our weekly webinars to see how you can harness these time cycles for yourself.