Skip to content Skip to sidebar Skip to footer

Trading time cycles

Trading time cycles can be challenging. Many of the time cycles that people look at when they are trading are based in very theoretical and murky waters. They end up in pretty subjective pools - either fibonacci or gann....wave theories...trading time cycles can be a very alluring but often times very ambiguous endeavor. It becomes a very subjective thing. When you find a guru in your pursuit of mastering these things, the guru only serves to frustrate you as they apply a constantly shifting set of rules when they are trading time cycles. It's never the same thing twice.

When trading time cycles with the Flux indicators, people can be faced with the same challenges. How to remove the subjectivity? How to make it less ambiguous...something that can be back tested, with signals that don't disappear and reappear, or the most carnal of trading time cycle indicator sins - repaint.

When we applied the Flux programs to the market data, we had a test for robustness. We wanted to see:

a. consistency across time frames

b. consistency across instruments

c. demonstrable statistics above the 60% barrier. Non-subjective statistics.

When you are trading time cycles with the Flux software, it's important to remember that. I forget, quite frequently, to check across a full range of time frames in the markets we study. I personally when watching markets have an aversion to going past 3,5 minute time frames. But see why that's a self harming characteristic in this example.

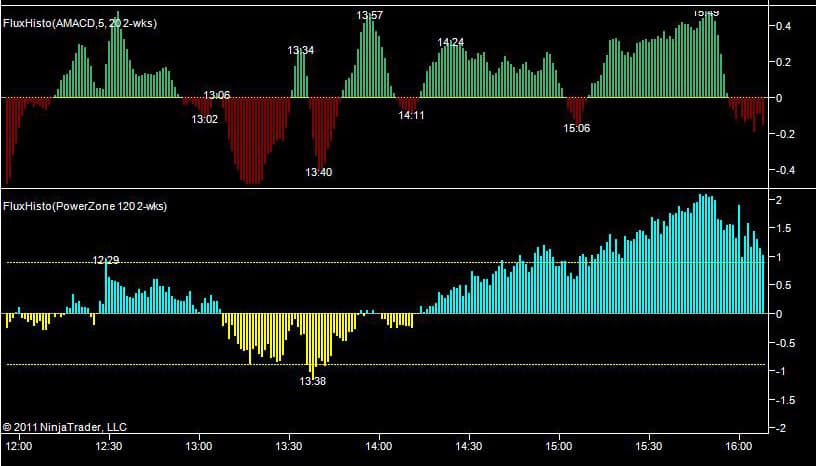
Look at how the Flux time cycles appear on a 5 minute chart in Gold Futures: (click here to enlarge)

Gold Futures, 5 min chart with Flux Time Cycle Markers

Do you see the consistency of the cycles as they appear on the candles? Each one of the marker times were known a week in advance. Their color. Which candle they would plot over or below. We want to see the confluence of signals near or close to actual market movements as a guide.

But now look at the same market, analyzed with the same tools, on a 240 minute time frame. A scaling factor of nearly 25.... Click here to enlarge:  http://screencast.com/t/V9aq3pBwgPwL+

Trading time cycles on Gold with Flux markers, 240M chart


That's what we want to see. These trading time cycles coming in on different time frames with the same consistency.

First, we have to pass the "eyeball" test. Are the forecast time cycles actually coming in at the highs and the lows that we were waiting for? From these charts, it would appear so.

Objectively though, does the evidence hold up? Or are we deluding ourselves like so many other traders to when they are trading time cycles?

In my next post, I want to show you the statistical evidence of the existence of these time cycles. It's pretty compelling - and we were excited, and nervous the first time we ran this strategy...


Stay up-to-date with
Real Time Market Calls

Risk Disclaimer

All forms of trading carry a high level of risk so you should only speculate with money you can afford to lose. You can lose more than your initial deposit and stake. Please ensure your chosen method matches your investment objectives, familiarize yourself with the risks involved and if necessary seek independent advice.

All information on this website or any product purchased from this website is for educational and research purposes only and is not intended to provide financial advice. Any statement about profits or income, expressed or implied, does not represent a guarantee. This training website is neither a solicitation nor an offer to Buy/Sell options, futures, cryptocurrencies, or securities. No representation is being made that any information you receive will or is likely to achieve profits or losses similar to those discussed on this website. The past performance of any trading system or methodology is not necessarily indicative of future results. Please use common sense. Get the advice of a competent financial advisor before investing your money in any financial instrument. 

CFTC Rules 4.41 - Hypothetical or Simulated performance results have certain limitations, unlike an actual performance record, simulated results do not represent actual trading. Also, since the trades have not been executed, the results may have under-or-over compensated for the impact, if any, of certain market factors, such as lack of liquidity. Simulated trading programs in general are also subject to the fact that they are designed with the benefit of hindsight. No representation is being made that any account will or is likely to achieve profit or losses similar to those shown. For more information read our full Risk Disclosure.

Testimonial Disclaimer

Testimonials appearing on this website may not be representative of other clients or customers and is not a guarantee of future performance or success.

Trademarks

* TradingView® is a registered trademark of TradingView, Inc.  which does not have any affiliation with the owner, developer, or provider of the products or services described herein, or any interest, ownership or otherwise, in any such product or service, or endorses, recommends or approves any such product or service.

NinjaTrader® is a registered trademark of NinjaTrader Group, LLC. No NinjaTrader company has any affiliation with the owner, developer, or provider of the products or services described herein, or any interest, ownership or otherwise, in any such product or service, or endorses, recommends or approves any such product or service.

Back to the Future Trading, Higher Purpose Inc. © 2025. All rights reserved. 

Customer Lounge

Quick Links