Cycle indicators have been notoriously lagging in the past, in the sense that they are attempting to measure something that is happening in the market real time. Most cycle indicators are not much different than an RSI for example, which is looking at market conditions as they are unfolding - measuring the average of some internal market value and displaying that value as some type of a moving average cross.
Once such indicators is the Schaff Trend Cycle Indicator that uses slow stochastics and the MACD, as wel as a cycle component to factor currency cycle trends. The indicator is purportedly faster than the cycle indicators that lack a cycle component and rely more on slower moving average cross type components. An example of the STC cycle indicator here shows how the STC cycle indicator generates its buy signal when the signal line turns up from 25 to indicate a long or turns down from 75 to indicate a short:

While this indicator can be called "forward looking" as a cycle indicator there is still the element of waiting for current market conditions to unfold to generate a signal. The down side of this type of a cycle indicator is that it still generates apprehension in the moment. A trader is reconciling what they see with this signal and always wondering if the cycle indicator, in this case the STC cycle indicator is correctly interpreting the market conditions or not, especially in volatility.
The designer of the Flux cycle indicator took this into consideration when he originally theorized that dominant market cycles could be measured from historical data and project forward. Like any other business in the world, the institutional trading conglomerates couldn't operate randomly - and had to have some sort of internal time based guidelines for when large trades were to be placed, and when large profits or losses were to be taken. This concept has elevated the idea of a cycle indicator to an entirely new level.
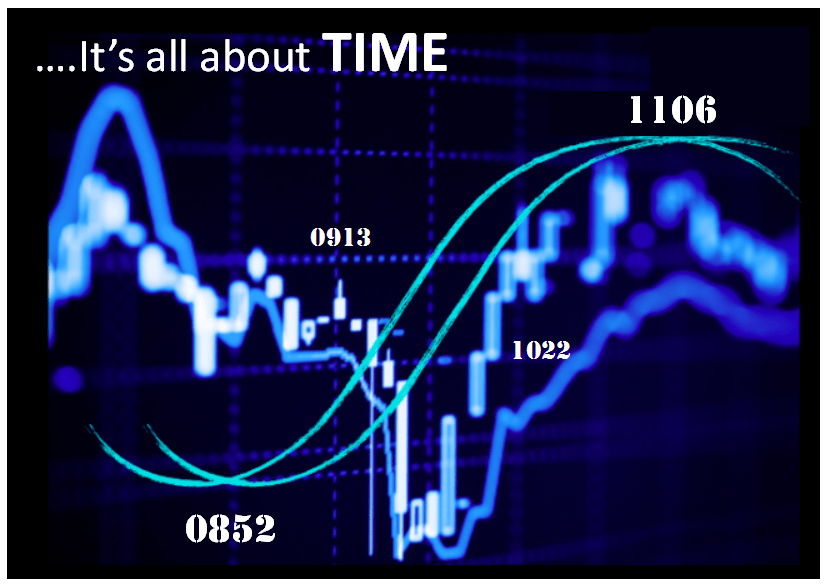
When the Flux cycle indicator was originally turned on, the designer was looking for graphical representations of cycles in the cycle indicator, as represented by peaks of histograms that showed up clearly as part of a sinusoidal (roller coaster looking) pattern. Here's an example of what is returned from the Flux cycle indicator:

In this case the user is not waiting for a line to cross so much as they are waiting hours in advance for a specific minute of the market to close, with the time of that minute known specifically days before the market opens. In essence, the cycle indicator is saying...."there is a very strong possibility that the market will sell off at 10:24, as it has done previously wiht statistical significance". This internal behavioral cycle is captured with data mining algorithms and displayed graphically for the trader to visualize the markets dominant behavioral cycles in advance of any line crossing - no matter how good the "cycle component" of the cycle indicator is.
The best way to visualize this is to register for one of the BTTFT online seminars, or fill out the BTTFT personal consultation form to watch the cycle indicators playing out in real time. One of the great advantages of these cycle indicators is that the company can post forecasts days before the online seminars, and then review the outputs of the cycle indicator after the fact and verify the potential robustness of the signals after the fact. This is something very few if any other cycle indicator developers can lay claim to, and can be a very powerful convincing factor for many traders.