When we first started time cycle trading, there was a phase of unbelief. When we looked at the time cycles generated by the Flux software that depicted the internal behavioral cycles of the markets, we began to really think that we were tumbling down some rabbit hole with no bottom. All of our suspicions about time cycle trading were confirmed by the forecasts and the time cycles provided days and hours in advance of the market actually opening. We started to see that these time cycles were indicative of a market that was no so much random - as it was choreographed and filled with business procedures and routines that occurred with regularity and like clockwork - less mysterious than the random "magical" world we were led to believe existed. Time cycle trading got a whole lot more interesting when we allowed ourselves to believe there was more to the market than random "efficiency".
I took the time today to compare what we're doing with our software to the techniques other vendors are attempting to teach and proliferate in the market. This one chart was of particular interest to me. People interested in time cycle trading that came across this photo probably reacted the same way I did:

In this diagram, the expert is attempting to show how his software can help you discern trades using Gann's teachings of "squares". This is a direct quote from the website:
"...Because the next 2 days is Saturday and Sunday, so I tried to start the square from these two days and find some vibration on 30, 45, and 67.5 (2/3) days. We can reasonably assume a 90 days high if the price is approaching the 90 days from low."
I've read through the page now a few times, and I always ask myself the same question. If someone trading time cycles came across this site, would they be able to determine for themselves what was being taught, and then how to apply it methodically and objectively real time in the markets? How would someone trading time cycles approach an entry or an exit - and would ten people following the same teachings all arrive at the same conclusions? How firm are the rules of interpretation with someone trading time cycles using this Gann technique? Listen to the next quote...
"I try to find out whether a chart is vibrate under the square of 90 by starting from all the recent highs and lows and visually spot matching turning points (vibrations) in the 8 divisions, especially in the 30th day, 45 day and 60day. 90 days is also 3 months, sometimes this could be the period of an counter trend out od a major trend..."
Trading time cycles had to be easier than a technique developed by a man 100 years ago...a man with no access to computers or online resources, no?
The next webpage in the list of people I came across when searching for "trading time cycles" was a company selling a book about Hurst techniques. In particular, JM Hurst - a man we had come across often in the pursuit of the ultimate time cycle trading techniques. What did they have to offer - surely it would be better than our Gann friend:
"The most surprising thing about our adaptation of Hurst's displaced moving average technique is that you don't have to spend any time doing tedious cycle analysis. Just click on a few bar highs or lows in the training software to get an idea of what periodicity is driving the trend and determine the best displaced moving average set with your eyeballs in the chart window. This becomes second nature after a few tries."
Just click on a few bar highs or lows to get an "idea". "With your eyeballs in the chart window"? Huh?
For $35.00 and a book later, I could learn the secrets though. No worries. Trading time cycles would be easy once I wrote a check. Ok...
Finally, I came across this in pursuit of comparative trading time cycles tools:

"...Plotted below these cycles is the speed of a third planet. A planet's speed reaches its extremes at perihelion and aphelion, the two points closest and furthest away from the sun. CycleTimer allows you to plot below your chart any combination of planets speeds added together or subtracted." Also, the ellipses were drawn in by hand, after the fact - showing how these were contained with the software's powerful "ellipse" techniques.
So, planetary motion....hand drawn ellipses....these were the tools being offered to traders looking for assistance trading time cycles?
It's no wonder we have such a hard time convincing people that there's an easier way. That these cycles actually exist, in a statistically meaningful way...
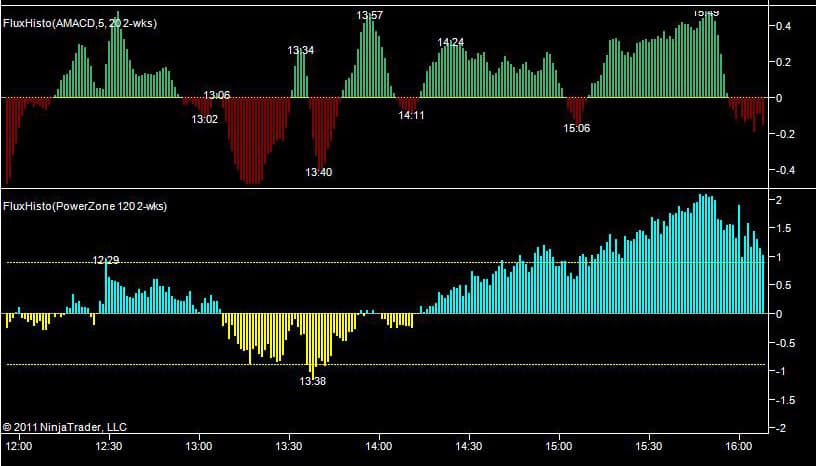
Look at one of our charts:

In our charts, it's fairly simple. There are red dots indicating a trading time cycle to the downside is coming. A trading time cycle that historically recurs at this exact time. Same for green dots. If you see green markers, than you are being alerted to the fact if you are trading time cycles that now - right here - right on this candle - is when you are expecting the market to go up. Time cycle trading can be simpler than you've been led to believe.
If you haven't already done so - register for one of our weekly webinars where we give the forecast times out days before the seminar - and review what actually happened after the fact to determine if these results are statistically significant. Compare for yourself - if you're looking to learn more about time cycle trading - which one of the methodologies is easier to follow and apply methodically.