
Uncover the true and hidden support & resistance levels of the markets
TachEon Fractals
- Set the time you want to re-start your study each trading day
- Set however many bars you want the software to mine the historical data (5,000 bars, default)
- Set the "significance" value, or height of the pivot swings you want to search for
- Set the filter percentage, i.e, the top "X" percent of pivots (0.2 "20%" default)
- Set the projected pivot line importance as "width" (thicker), "opacity" (brighter), or "both"
- Apply the indicator multiple times, referencing higher time frames
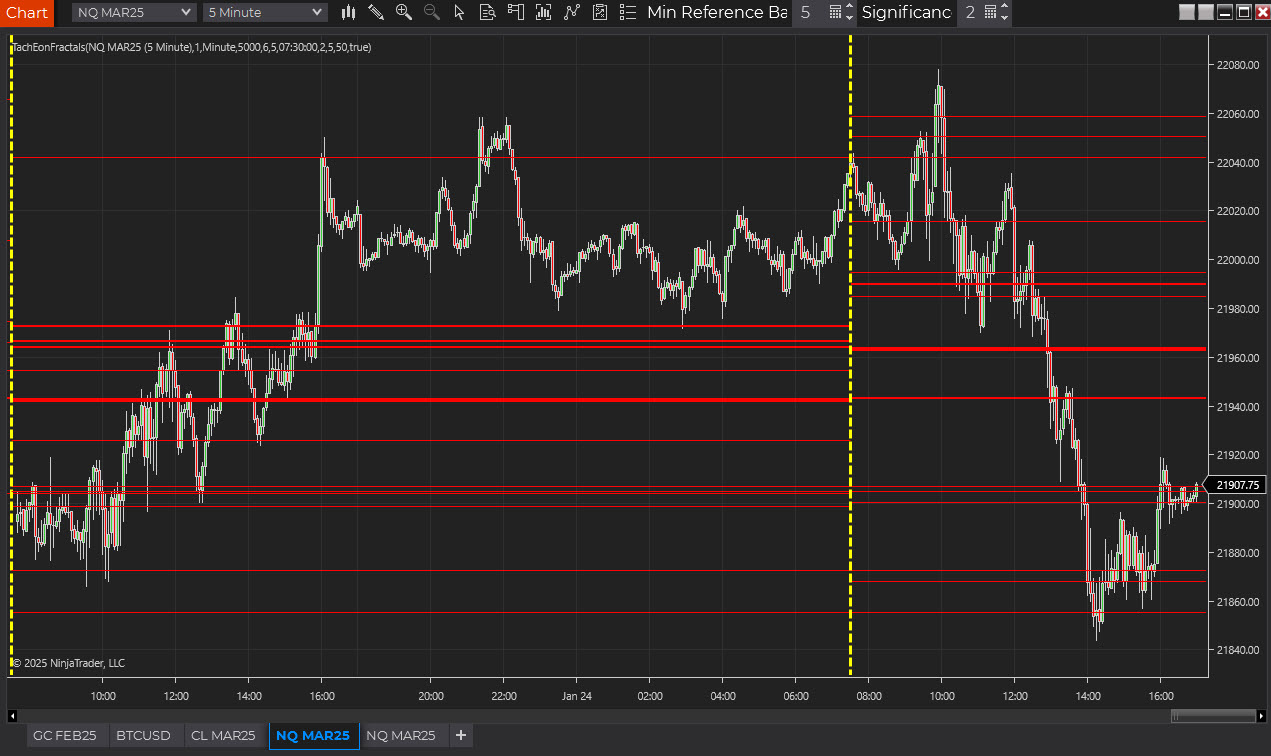
Predictive Price Action:
- These horizontal lines represent the pivots most likely to cause price to bounce, again
- Clusters of support or resistance reinforce a trading position and provide additional confluence (5,000 bars, default)
- The distance between lines allows traders to quickly evaluate the available risk to reward ratio
- Prevents traders from overemphasizing local pivots as opposed to battle hardened pivots with hundreds of bounces
Product Features:
- 'To the tick' entries and exits
- Quickly evaluate areas of potential congestion (multiple lines) and areas of trend ("line free" price zones)
- Qualify trades by the thickness/opacity of the relative support and resistance levels
- Set price alarms to sound when the market is near relevant areas to prevent overtrading
- Set the "recalculate" value to "0" to constantly update new "top gun" pivot prices
Fractals
Software Requirements:
- Requires a PC or Trading Server capable of running the current version of NinjaTrader .
- An active NinjaTrader user account.
- A reliable high speed, low latency internet connection.
- Sound knowledge of market trading fundamentals and familiarity with the NinjaTrader Desktop App.
- Read and Accept our Risk Disclosure
Best Value
Get Tacheon Fractals
1 Year Commitment - Annual pricing equates to value of $83/mo
$995/yrAuto-bills every year to prevent disruption of service
SubscribeSemiannual
Get Tacheon Fractals
6 Month commitment - Breaks down to a value of $125/mo
$749/6moAuto-bills every 6 months to prevent disruption of service
SubscribeMonthly
Get Tacheon Fractals
"Pay per month" subscription with no multi-month commitment
$149/moAuto-bills each month to prevent disruption of service
Subscribe