Logik HD Volume Scanner
The Logik Volume Scanner is quite possibly one of the most exciting and insightful trading edges available for professional traders and investors. This simple and intuitive tool allows you to see a dimension of the market you trade providing intricate and powerful information that most traders in your markets will never see.
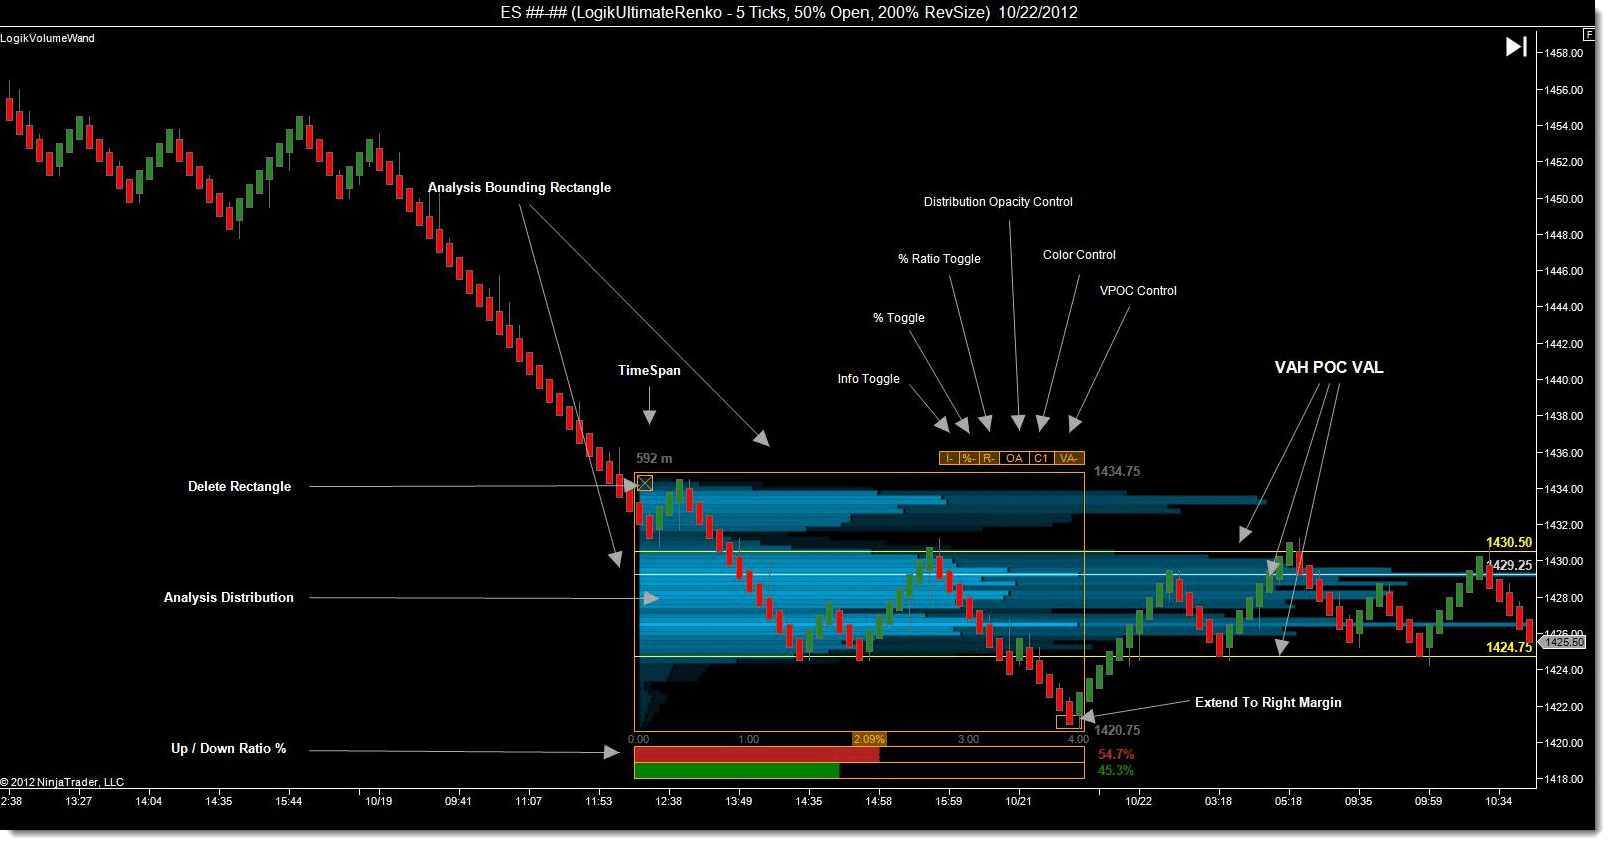
The Logik Volume Scanner is a feature rich volume, tick, and price distribution analysis tool. It displays volume and tick distribution information computed within the user drawn rectangle, combining the usefulness of Volume Point of Control, Volume Delta, and Volume Footprint analysis into one intuitive tool. The user may manage as many volume analysis boxes as desired, at either a focused region of one bar, or large region transpiring over any range of time. Below is an image of the wands feature rich interface and data analysis presentation.
The Big Picture
As noted above, the Logik Volume Scanner allows the user to perform volume profile over any size price / time region. The Logik Volume Scanner comes in two versions. The Logik Volume Scanner, and the Logik Volume Scanner HD. Both versions pack the same features, however the HD version provides the additional feature of utilizing tick data to provide a higher degree of accuracy. When using non-time bars that utilize tick data – the Volume Scanner becomes like an “HD” television, with more “resolution” into the price action we’re studying.
What’s most exciting about this tool, its the innovative user interface. There simply isn’t an indicator like this in the entire NinjaTrader arena of tools. The way that you interact with this tool is truly a fresh and new experience with applying an indicator on your chart
Analysis Bounding Rectangle
- This rectangle is drawn anywhere on the screen once per Scan applied that you wish to control. To initiate, click the Logik Volume Scanner button on the toolbar, click the chart and move the mouse to the desired location. To initiate another, simply repeat this procedure.
- The analysis calculations are updated on the fly as the user resizes and moves the rectangle.
- The analysis is performed based on the data within the bounds of the rectangle.
- Moving the Rectangle
- Once the rectangle is drawn, the user may mouse click and drag over either the vertical or horizontal side of the rectangle to move it. The side will highlight as the user hovers over it.
- Sizing / Resizing the Rectangle
- In order to resize the rectangle, the user may mouse click and drag over any corner of the rectangle, and drag the corner to the desired size. The corner will highlight as the user hovers over it.
Analysis Distribution
Illustrates the analysis distribution over the bounding rectangle, with 2 possibilities based on bar type:
Type 1: Logik Volume Scanner Non-HD
- VOC – All the volume of a bar gets applied into the closing price of that bar.
- TPO – Each price in the range of a bar gets a single hit (disregards volume).
- VWTPO – Each price in the range of a bar gets an equally divided portion of the bar’s volume
- VTPO – All the volume of a bar gets applied to each price in the range of the bar
Type 2: LogikVolumeWand HD Version
- VOLUME – Each price is given the volume at that price
- TRADES – Each price is given a single hit
How to change the parameters
The following are a list of parameters that can be changed on the fly, live in the market at each analysis window:
- Display the Up vs. Down Ratio via histogram and numeric values.
- LogikVolumeWand Version – Ratio is based on Bars
- LogikVolumeWandHD Version – Ratio is based on Ticks
- Weighted / Non Weighted by volume
- Three lines are displayed.
- Value Area High
- Point of Control
- Value Area Low
On The Fly Controls
- Info Toggle – Toggle on / off the time and high / low price display
- % Toggle – Toggle on / off the Histogram measure %
- % Ratio Toggle – Toggle on / off the Up / Down Ratio % Histogram
- Distribution Opacity Control – Select manual opacity level or auto opacity level
- Color Control – Select grayscale, input color, or multi-color wheel
- VPOC Control – Select VPOC display off / rectangle bounded / extend to margin
Extend to Right Margin
- Allows the user to select 4 levels of how the distribution is displayed.
- Each level pushes the distribution closer to the price margin
Delete Analysis Rectangle
- Allows the user to remove an Analysis rectangle
Check out this live video demonstration that shows all the features on screen:
$495.00 USD One Time Purchase