Logik Dynamic Range
Captures Volatility, with artificial indicator intelligence
Range bars take only price into consideration, therefore, each bar represents a specified movement of price and time is eliminated from the equation.
When creating traditional range bar charts, there are three rules.
- Each range bar must have a high / low range that equals the specified range.
- Each range bar must open outside the high / low range of the prior bar.
- Each range bar must close at either its high or its low.
- There are two fundamental flaws with this design.
Flaw No. 1 - Static Range vs Dynamic Range Calculation
First, the range utilized by the bar is static. Specifying the degree of price movement for creating a range bar is not a one-size-fits-all process. Different trading instruments move in a variety of ways. A typical solution to this issue would be to determine the Average True Range for an instrument, and specify the range bar input to that value or some close variant thereof. While this method is descent, an ATR lags based on the period specified, and it fails to dynamically adjust the range as the volatility of the day changes. Specifically, an instrument is more volatile during a session start time.
The LogikDynamicRange solves this issue by employing a non lag range determination technique. Rather than using a lagging ATR, the LogikDynamicRange algorithm adapts itself bar by bar, detecting and resolving any computed error from the prior bars range. The algorithm then utilizes this error to compute the next range bar size. This continuously adaptive technique sizes the bar throughout the day, capturing trends while displaying consolidation areas very easily.
The LogikDynamicRange features two controls for the algorithm. A minimum range, and a maximum range. These inputs define how small / large the bar can get, allowing the trader to fit his / her trading style.
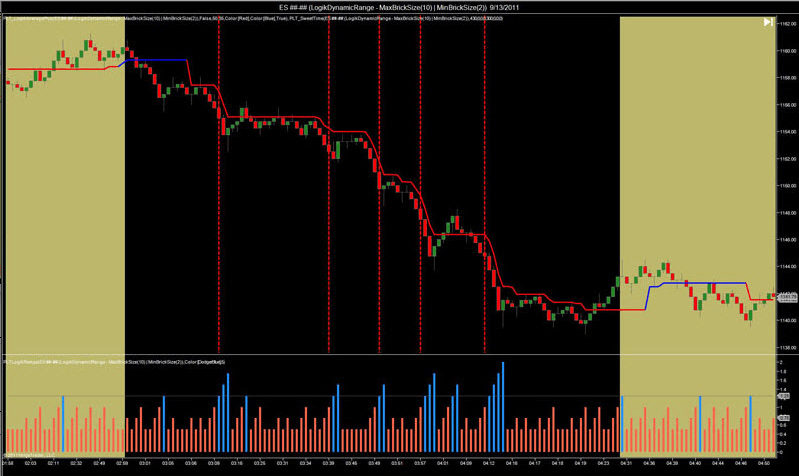
Using a simple indicator, the PLT_LogikRange(which is free with this bar type) depicts the areas where the range is adapting to a larger size, and therefore a trend is developing. The red vertical lines depict potential entry points short, during the European Market Open.
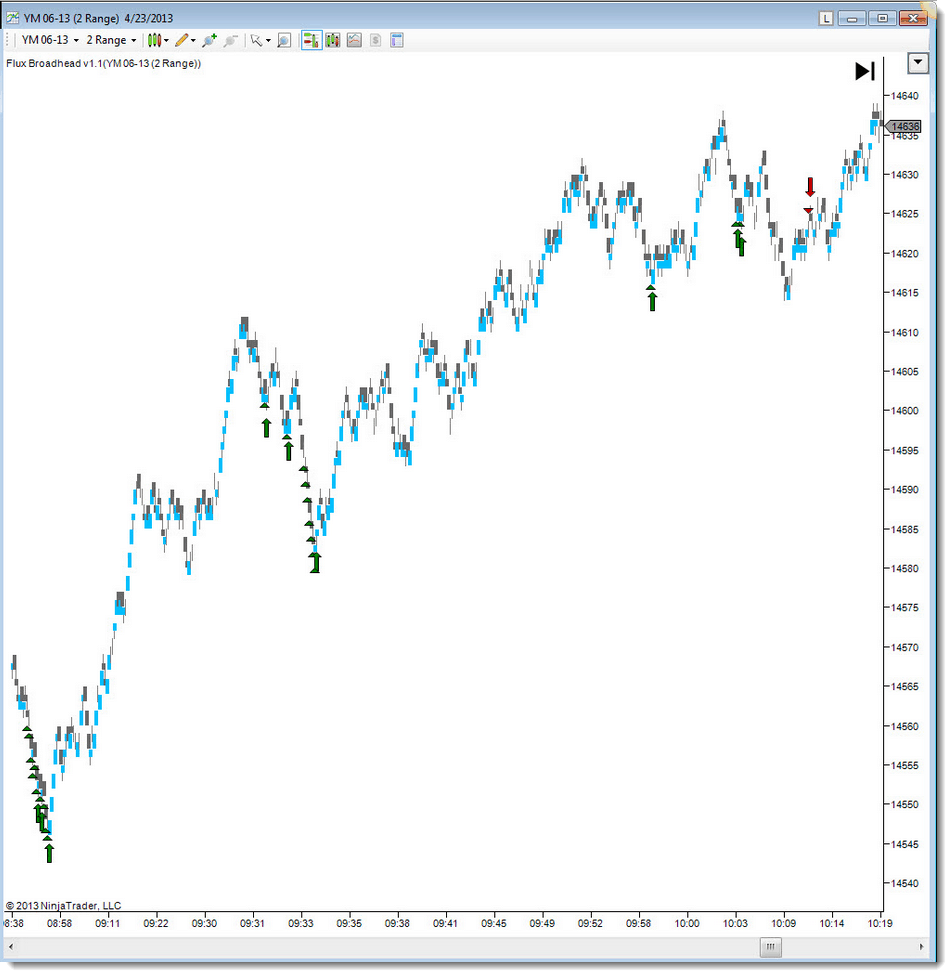
Look at these two examples of the same market…the first is a emini Dow chart with a standard and conventional 2 tick brick range size with a Flux Broadhead signal applied for trend entries on bar close:
Now, let’s apply the same 2 tick minimum brick range, with a 12 tick dynamic range bar upper threshold. Do you notice any difference?
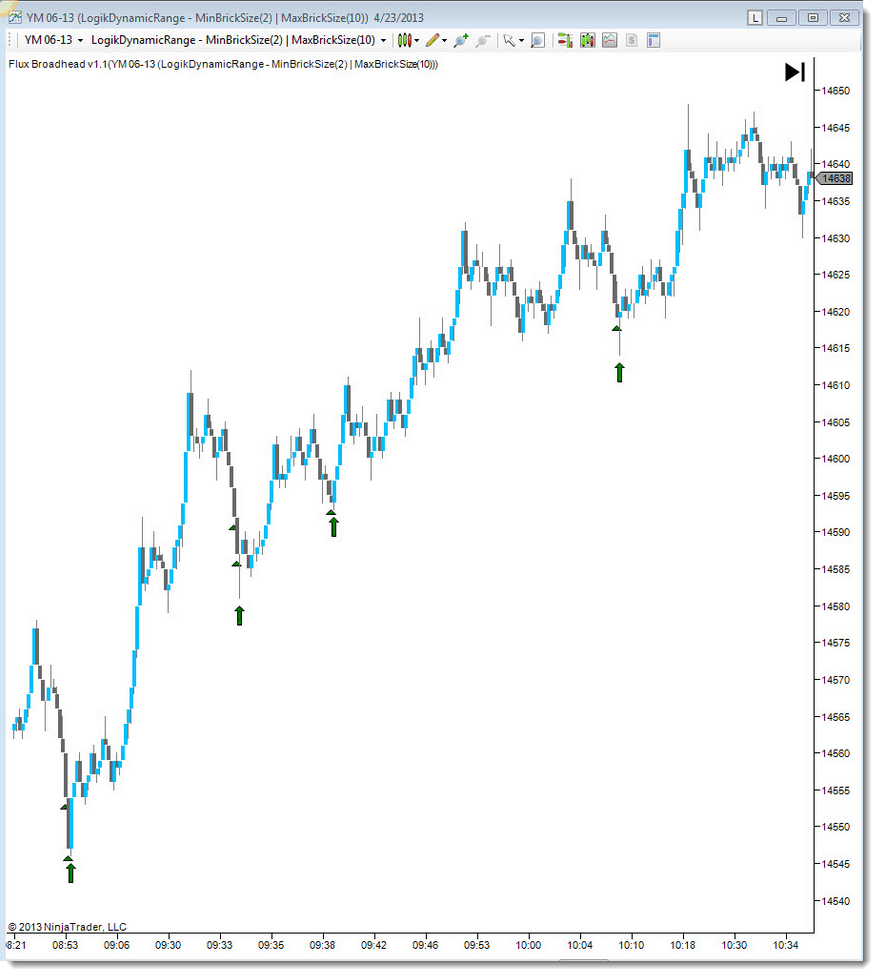
Two things are immediately apparent when looking at the chart. First, the noise created in a fixed range bar chart disappears as the Logik Dynamic Range bars expand when the market goes into a trend, and contracts back into a 2 tick bar range when it begins to consolidate. As a result, the Flux Broadhead signal exhibits far fewer of the typically observed “false flags” the indicator is famous for displaying as a result of the dynamically adjusted bars. Second, a trader observing the bar heights can intuitively see when the market is over-reaching. Once at the maximum range, it becomes very easy to see consolidation.
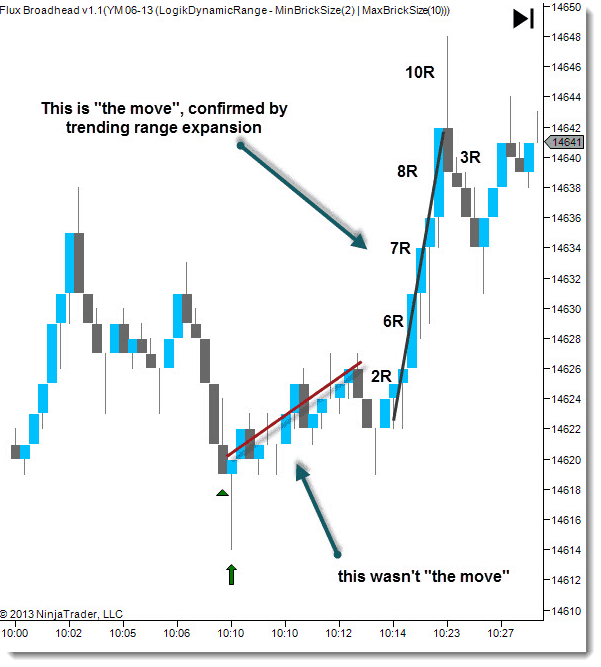
This can also answer the question – objectively – “did I miss the move?”.
Flaw 2 – Open outside of High / Low vs Open @ Prior Bar Close
A second flaw with the traditional Range bar is that the open price of a new range is drawn outside of the high / low range of the previous bar. This introduces 1 tick of noise on each new bar, which leaks into any indicator that is applied. While the LogikDynamicRange follows this rule when forming a new brick, the actual opening price of the bar is displayed at the prior bar close. Utilizing this technique, any indicator applied to the LogikDynamicRange has 1 tick per bar of noise removed from its computation, and therefore its smoother and more responsive.
Spurious Noise Filtering
Depending on the real-time tick filter algorithm implemented by the platform, a spurious tick price may pass through from a broker’s data stream. Since the LogikDynamicRange chart algorithm uses pure tick data as it is received from the broker, this noise may create bricks which are inconsistent with the true in a whip saw manner. Although the effect on the price is minimal since the chart price is dependent on the latest tick, any indicator applied to the chart will be useless since this price data is filtered into it. This effect increases as the input size of the brick decreases.
The LogikDynamicRange implements a real-time tick filter independent of any other filter. The algorithm is designed to eliminate this whip saw effect without removing important price information. Spurious ticks are detected, classified, and disregarded.
Reduced Risk Trades
Many traders employ a trend following technique or methodology that comes with an inverse risk to reward profile. Traders take consecutive small losses testing the market for trend, eventually catching a lower percentage of larger directional movements that counteract the more frequent smaller losses, and edge accounts into profitability.
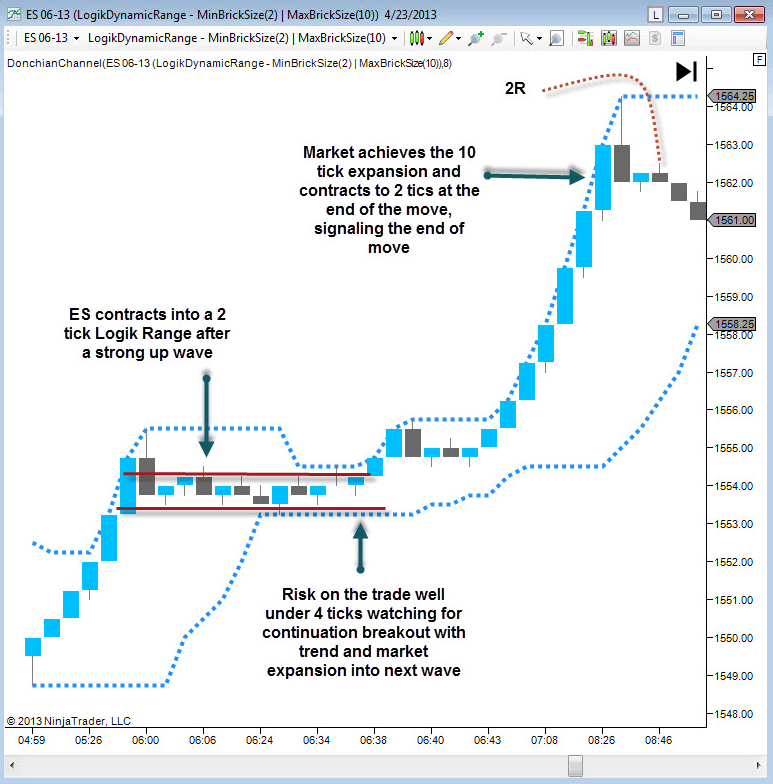
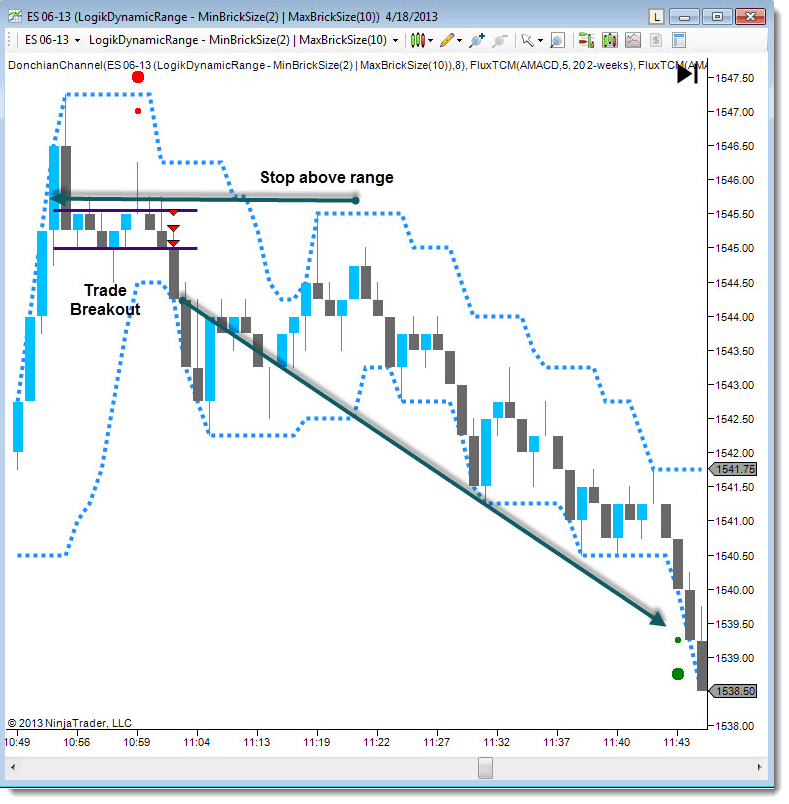
Leveraging the dyanmic nature of the Logik Dynamic Range, traders can observe areas of the market where the range retracts back to the minimum range bar size, effectively defining the lowest potential risk areas to test teh market for breakouts or continuation movements. When the market is at the upper threshold of the dynamic range, traders have an objective “touchstone” alerting them to “sit on their hands” until the next accumulation or distribution phase of the market
Daily Reference Consistency
Tick based charts in general are non-perturbative. Perturbation theory describes how the response of a known system changes in response to small changes in its parameters. In this application, the parameter is the Reference. This means that depending on the Reference point, the brick anatomy on any particular day may be different. A small change in Reference may incur a rather large change on the chart. The traditional LogikDynamicRange can be different for a specific day depending on how many days of data are loaded. This is unacceptable, and the proper selection of the Reference is critical, and must be done on a day by day basis for chart consistency.
Rather than arbitrarily selecting the first tick of a dataset, the LogikDynamicRange takes a different approach to selecting theReference. This approach removes the non-perturbative effect, making all charts persistent regardless of the number of days loaded.
Suggested Trading Setup
Identify lower range consolidation patterns at Flux turning time areas for low risk test entries. Trade 2 lots and move to a break even position as soon as possible, allowing runners to follow market to an opposing Flux behavioral time pattern
$275.00 USD One Time Purchase