Logik Bar Radar
Pure Logik’s Bar Radar reveals volume distribution inside of the bars on your chart, breaking out valuable data and putting it live on the screen in a “heads up display” format.
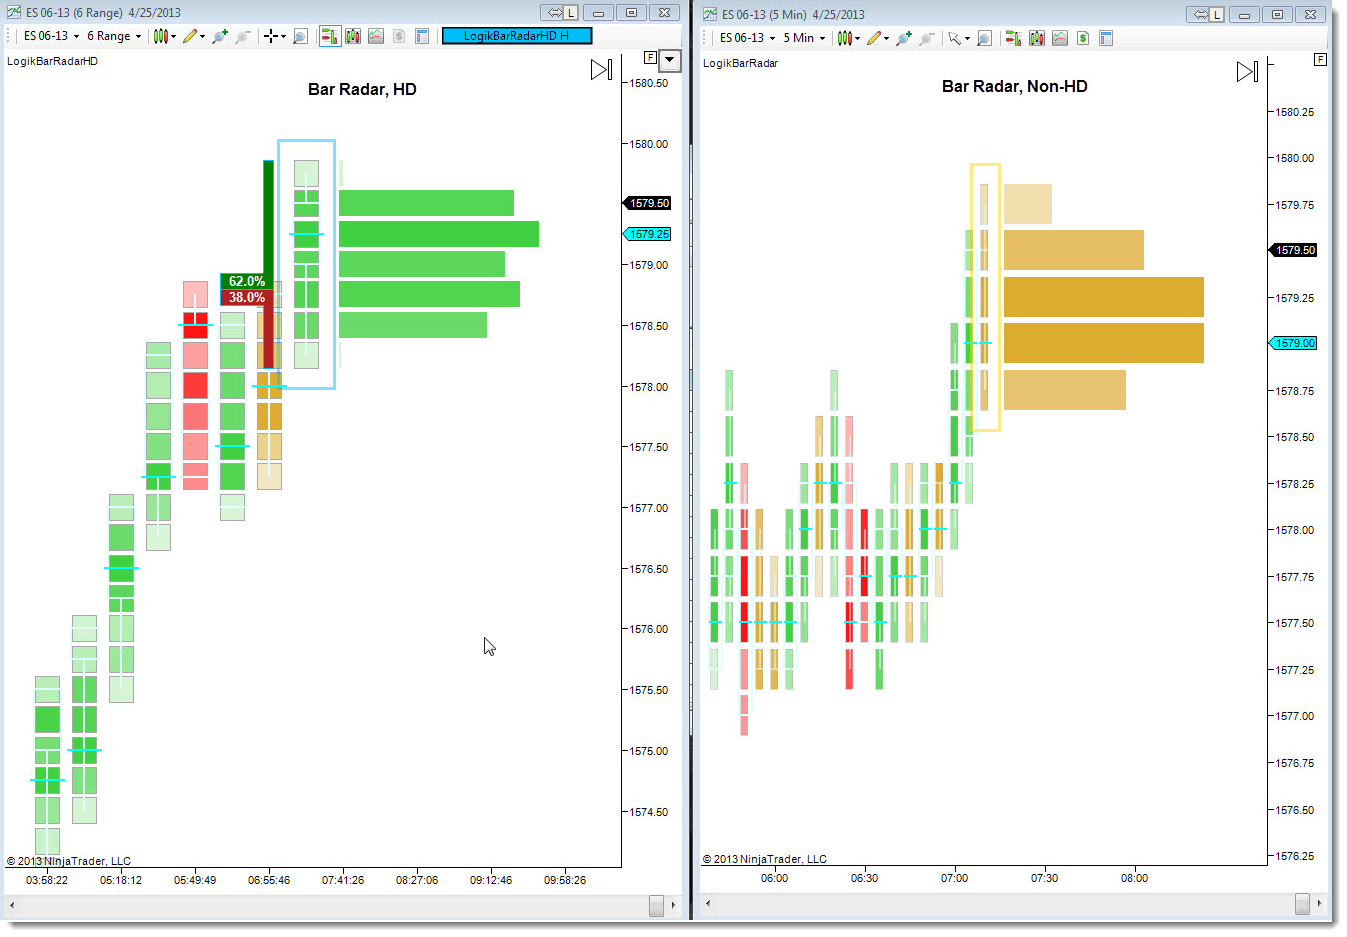
In the HD version, bars are broken evenly into quad-cells that allow the software to:
a. display volume distribution per cell as each price trades
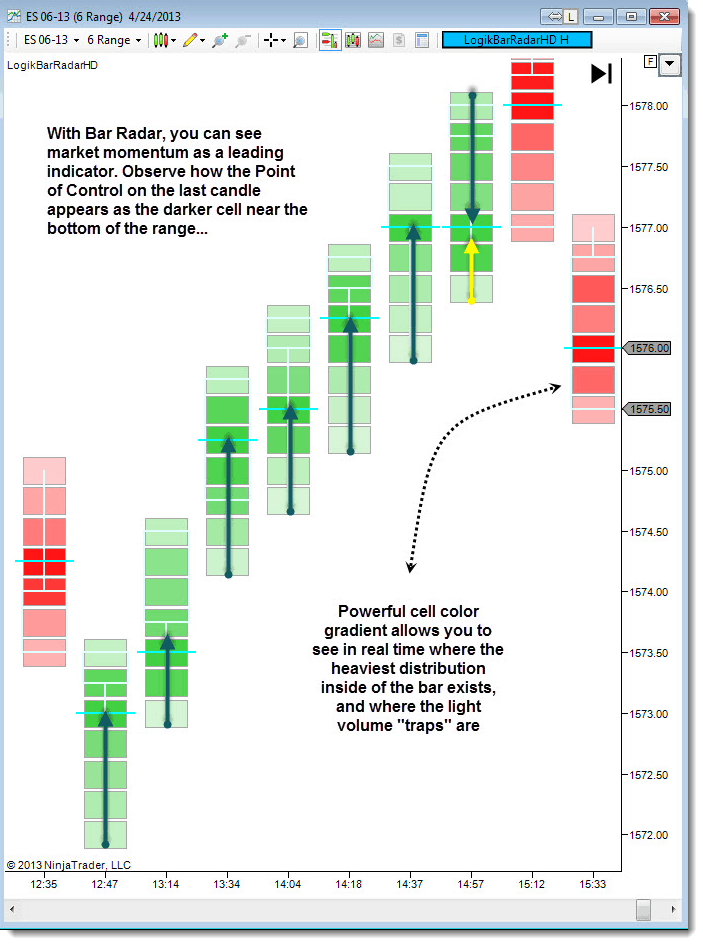
b. reveal the point of control of each bar, as the bar forms
c. Color each quad-cell with a gradient, helping you quickly see how price action is building in the bar
d. display the overall uptick / down tick percentage of the bar revealing the balance of interest in real time.
Watch the “real” market building, live
Using Bar Radar from Pure Logik, you’re fingers have never been closer to the pulse of the market you trade.
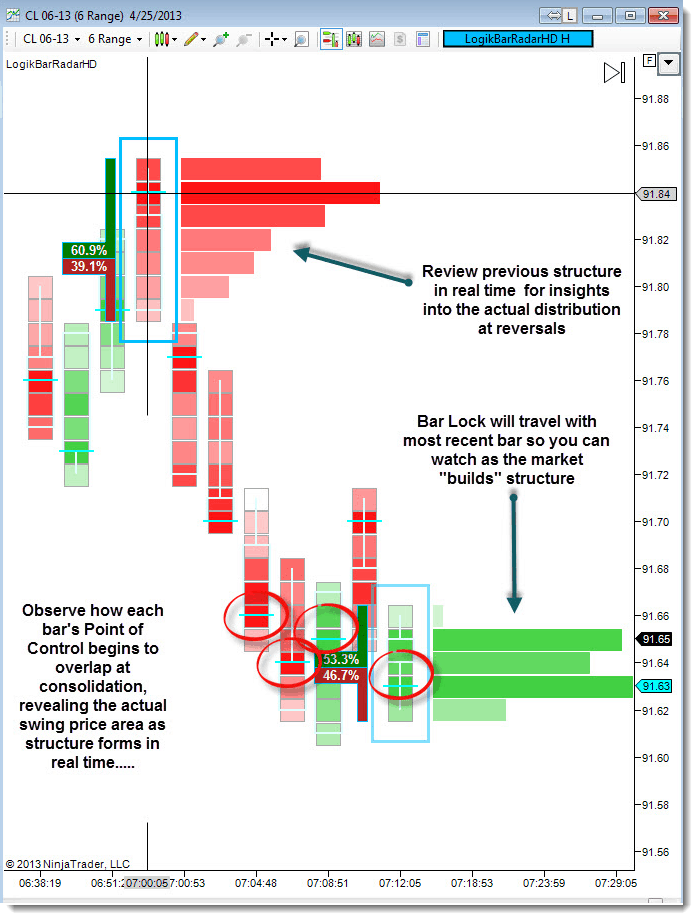
Point of Control Visibility
We love how Bar Radar’s innovative Point of Control hash mark begins to show the actual price inside of a consolidation range that marker makers are accumulating or distributing their positions. These POC clusters are especially useful when trading trend pullbacks into prior support or resistance. Where most traders place their entries at the tops or bottoms of previous consolidation – Bar Radar traders will see the truer entry several ticks up or down into the consolidation block.
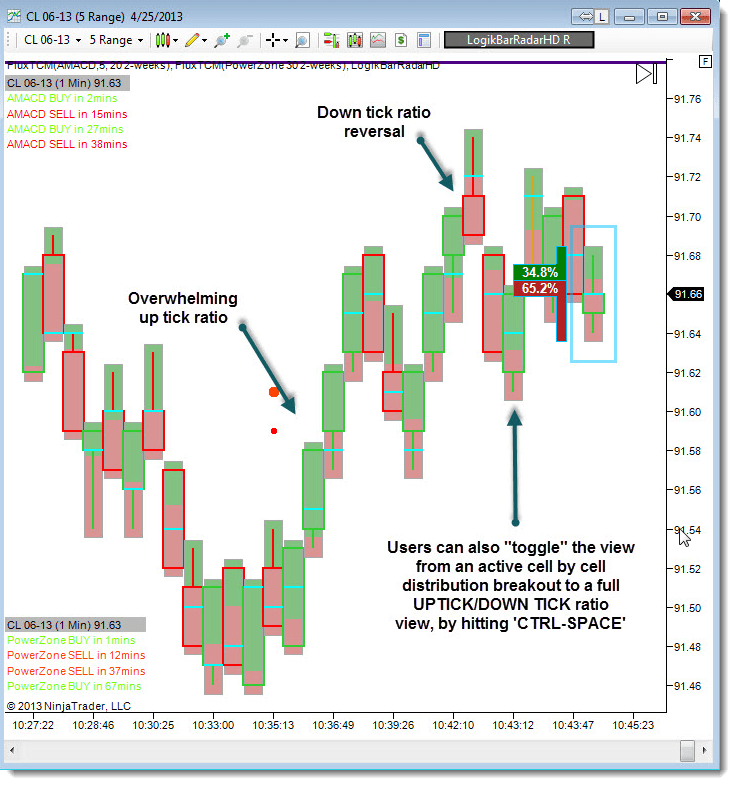
Finally, users can toggle between a distribution breakdown view, and a total percentage of up ticks and down ticks view, using ‘CTRL-SPACE’
$395.00 USD One Time Purchase