Trading Insights

Trading Insights

Emini-S&P 500 – Crossover in the 120 EMA

Trading Insights
featured image

When you trade with Warp predictive software you learn how to read the hidden price action when a signal appears.

If you have doubts, I invite you to join the live trading sessions.

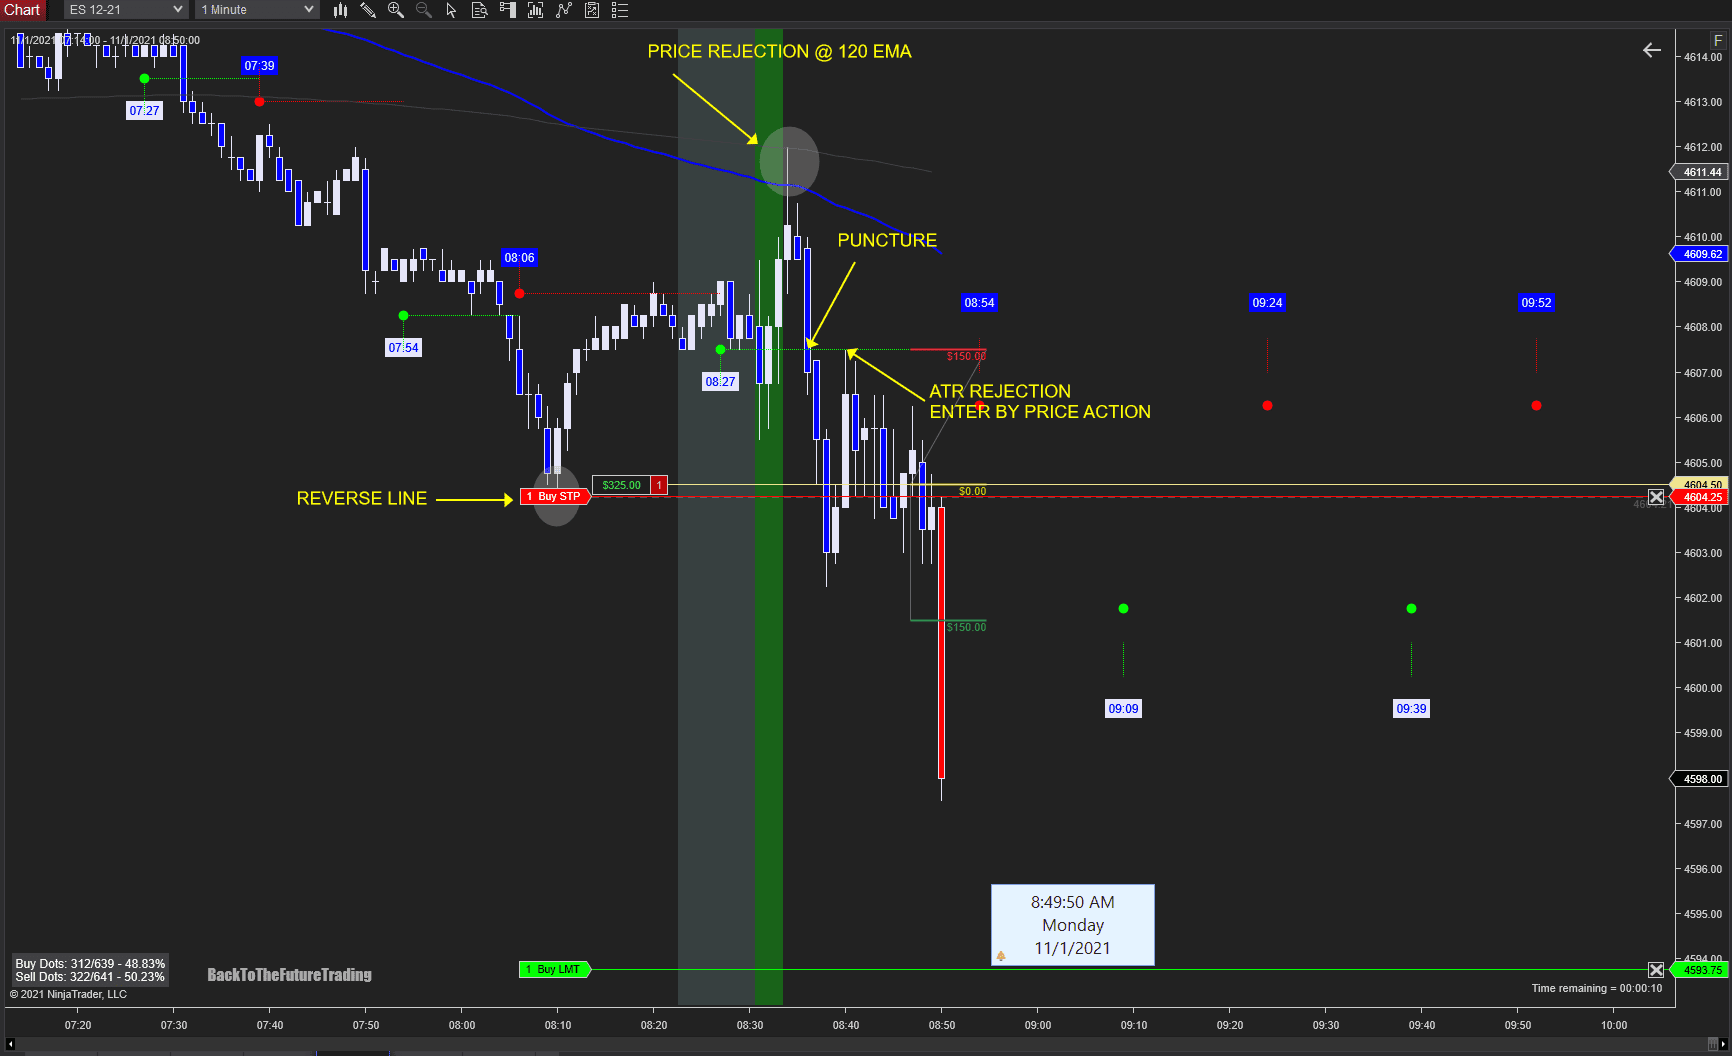
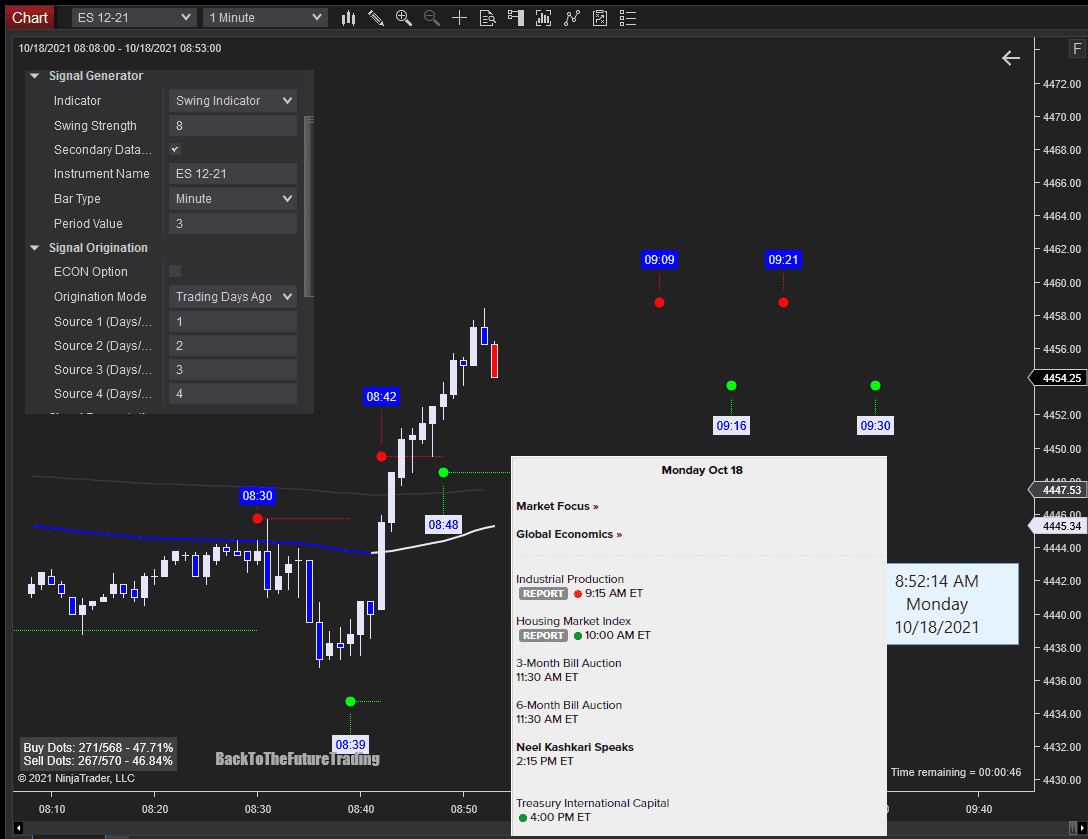
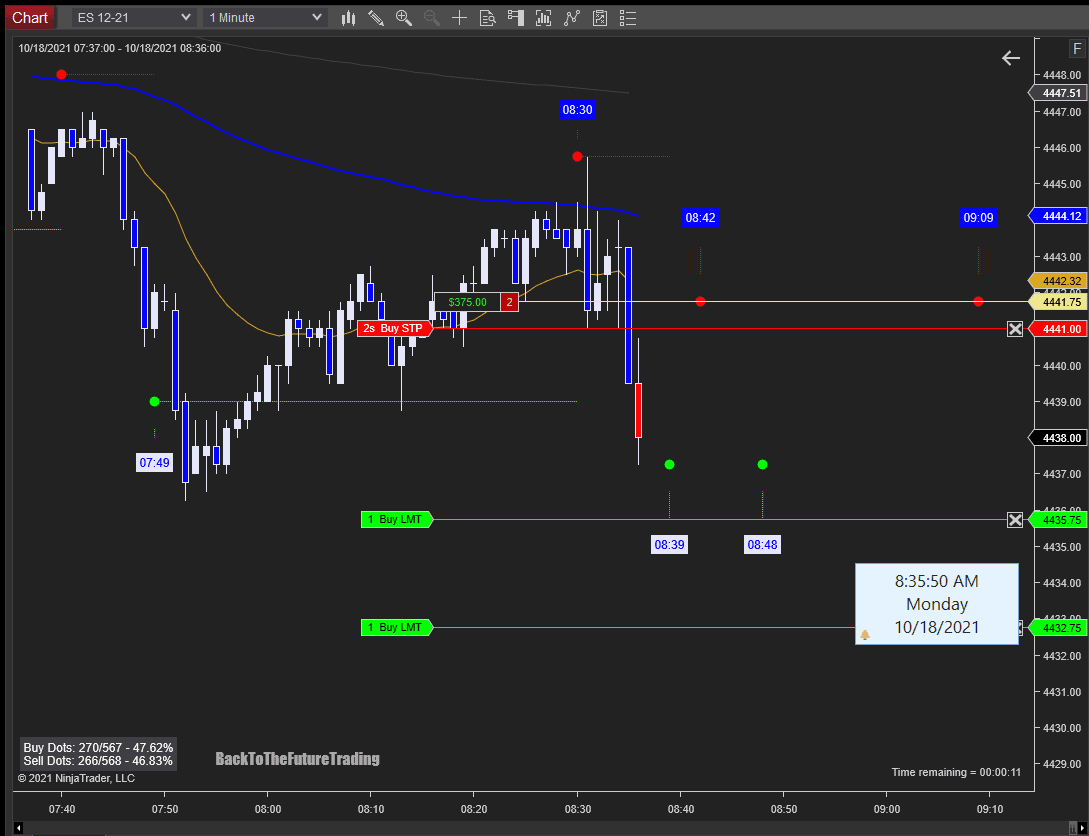
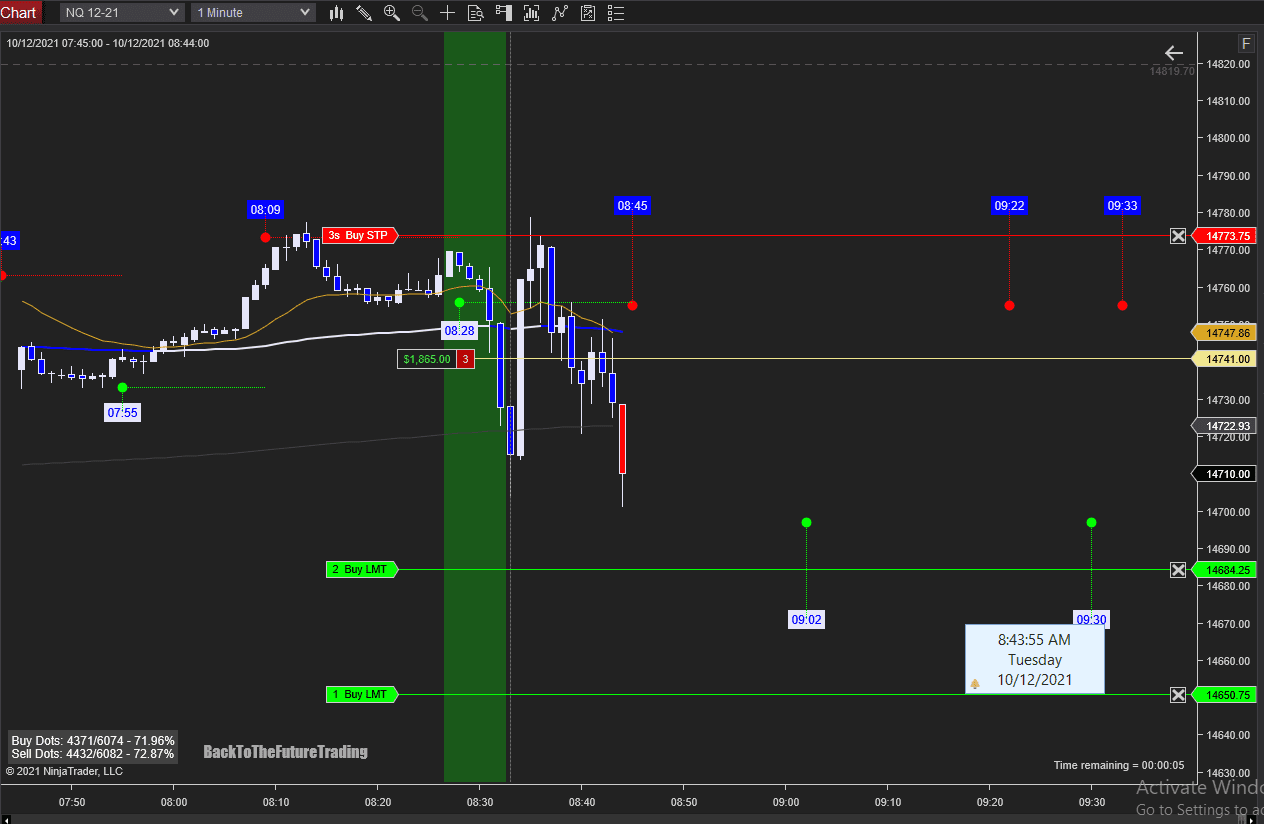
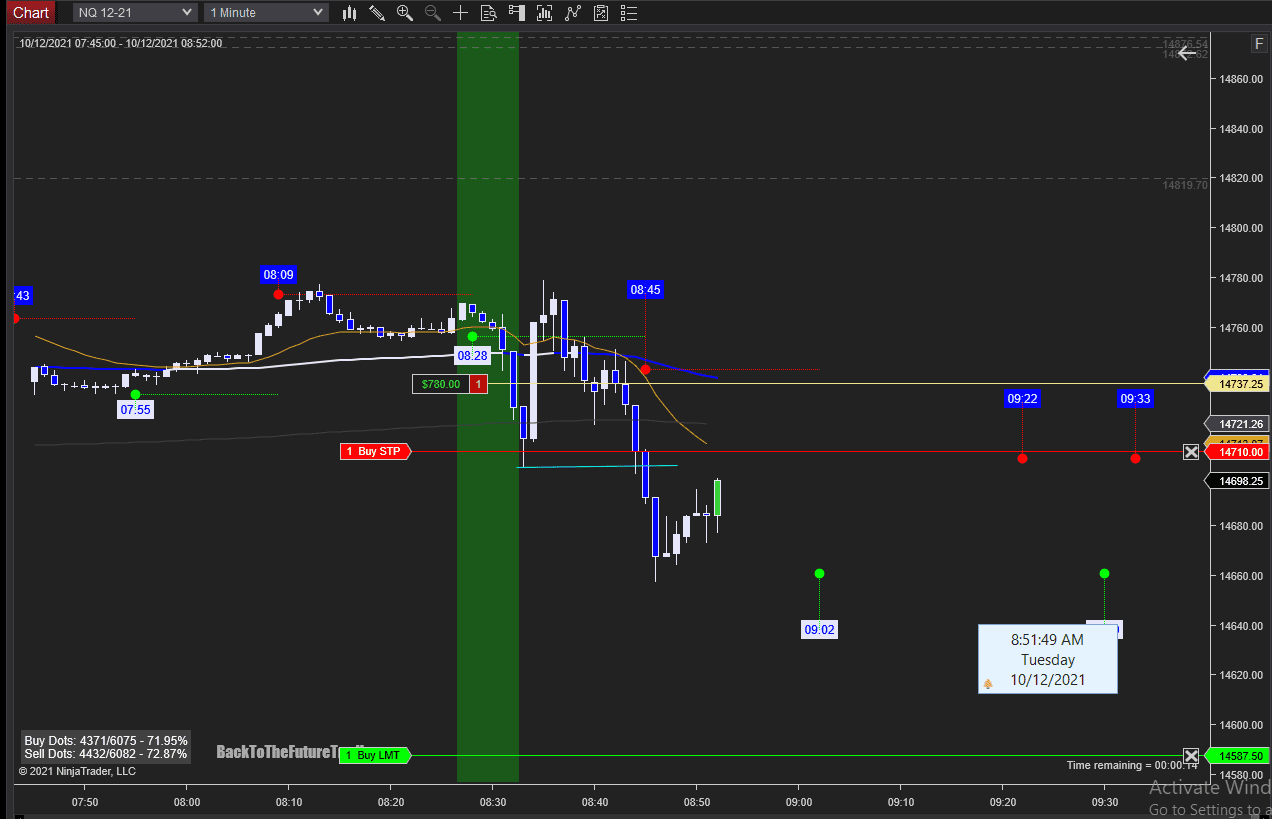
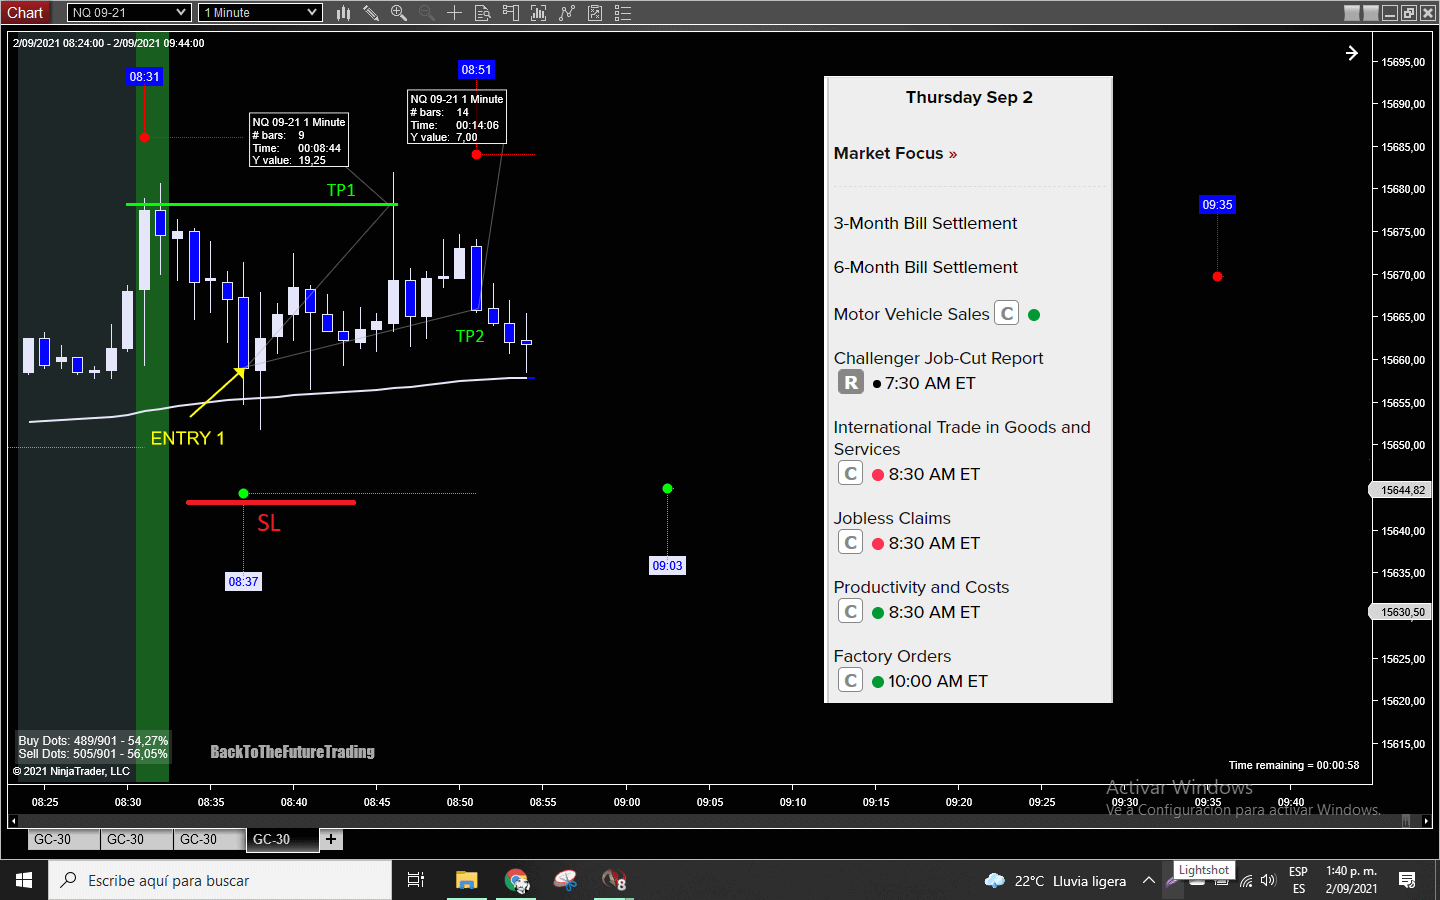
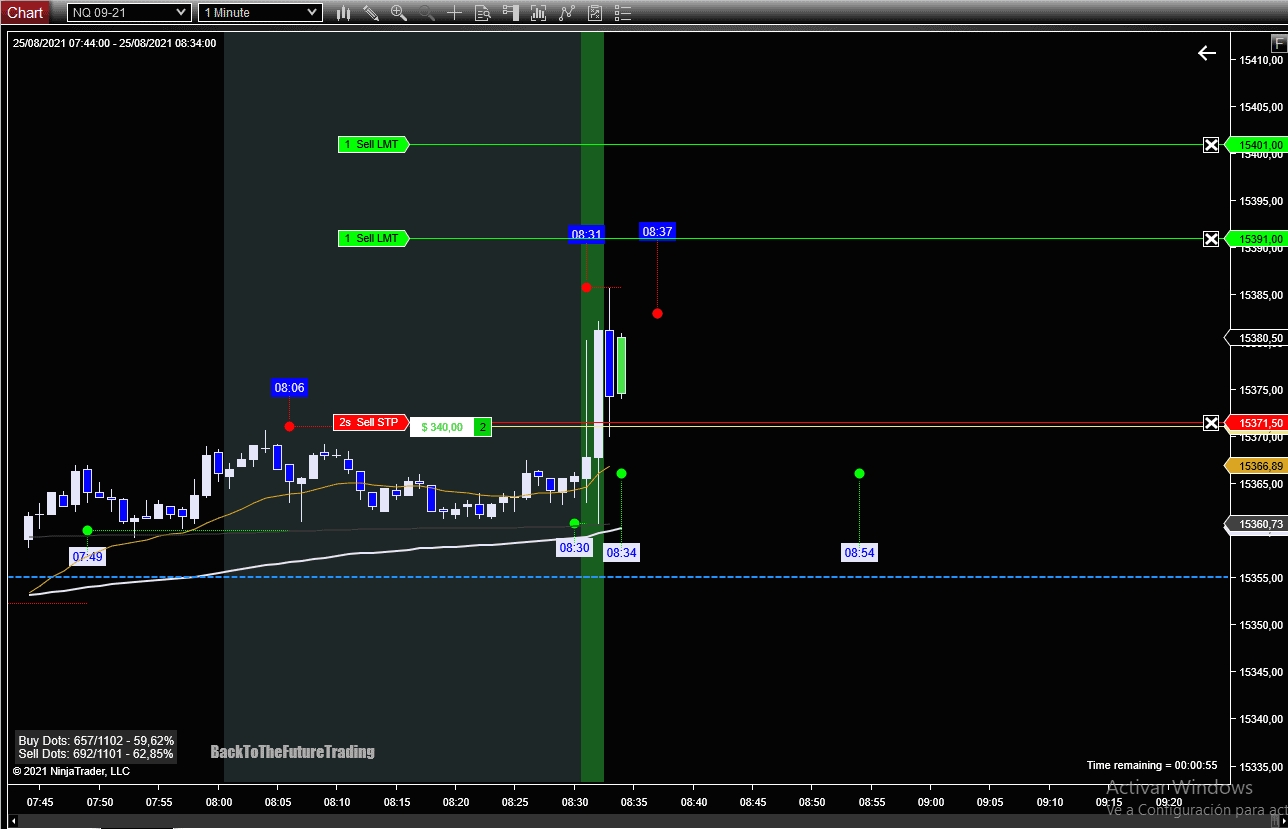
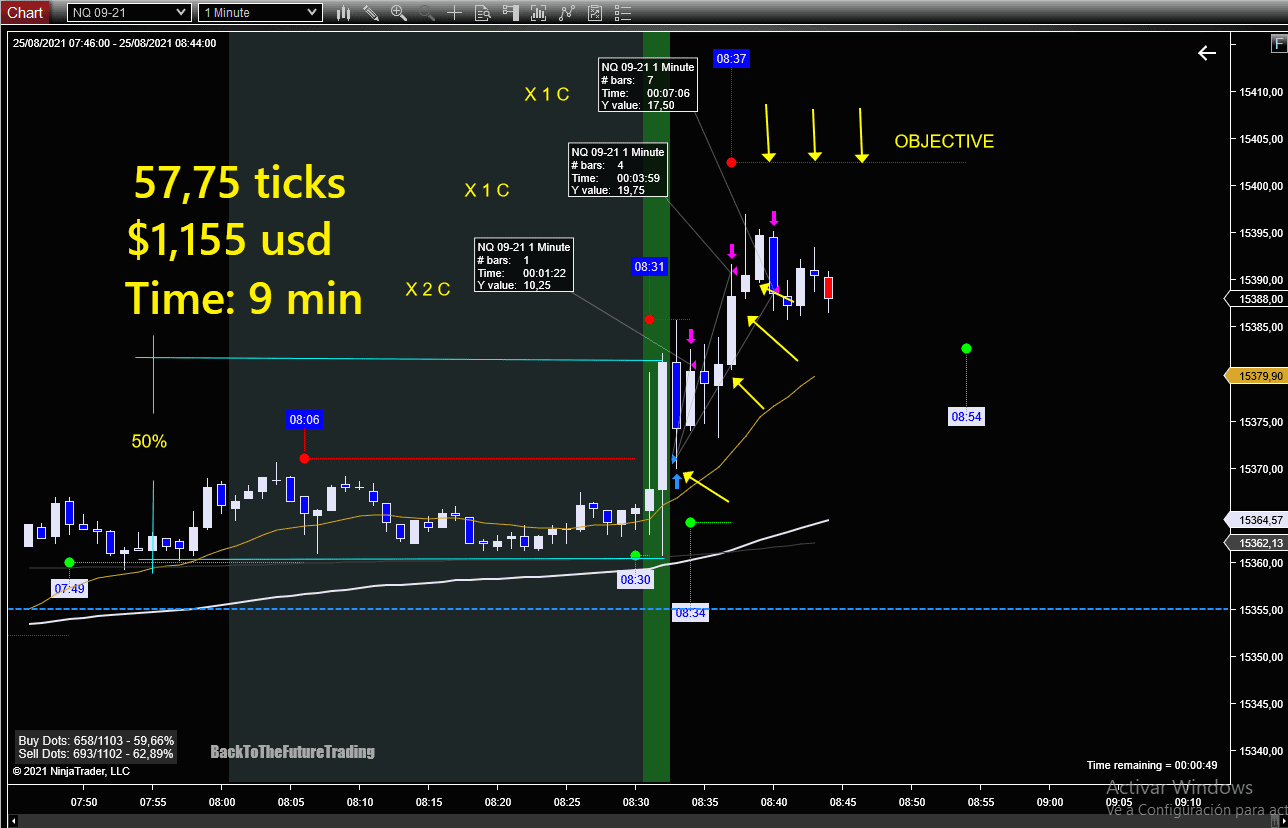
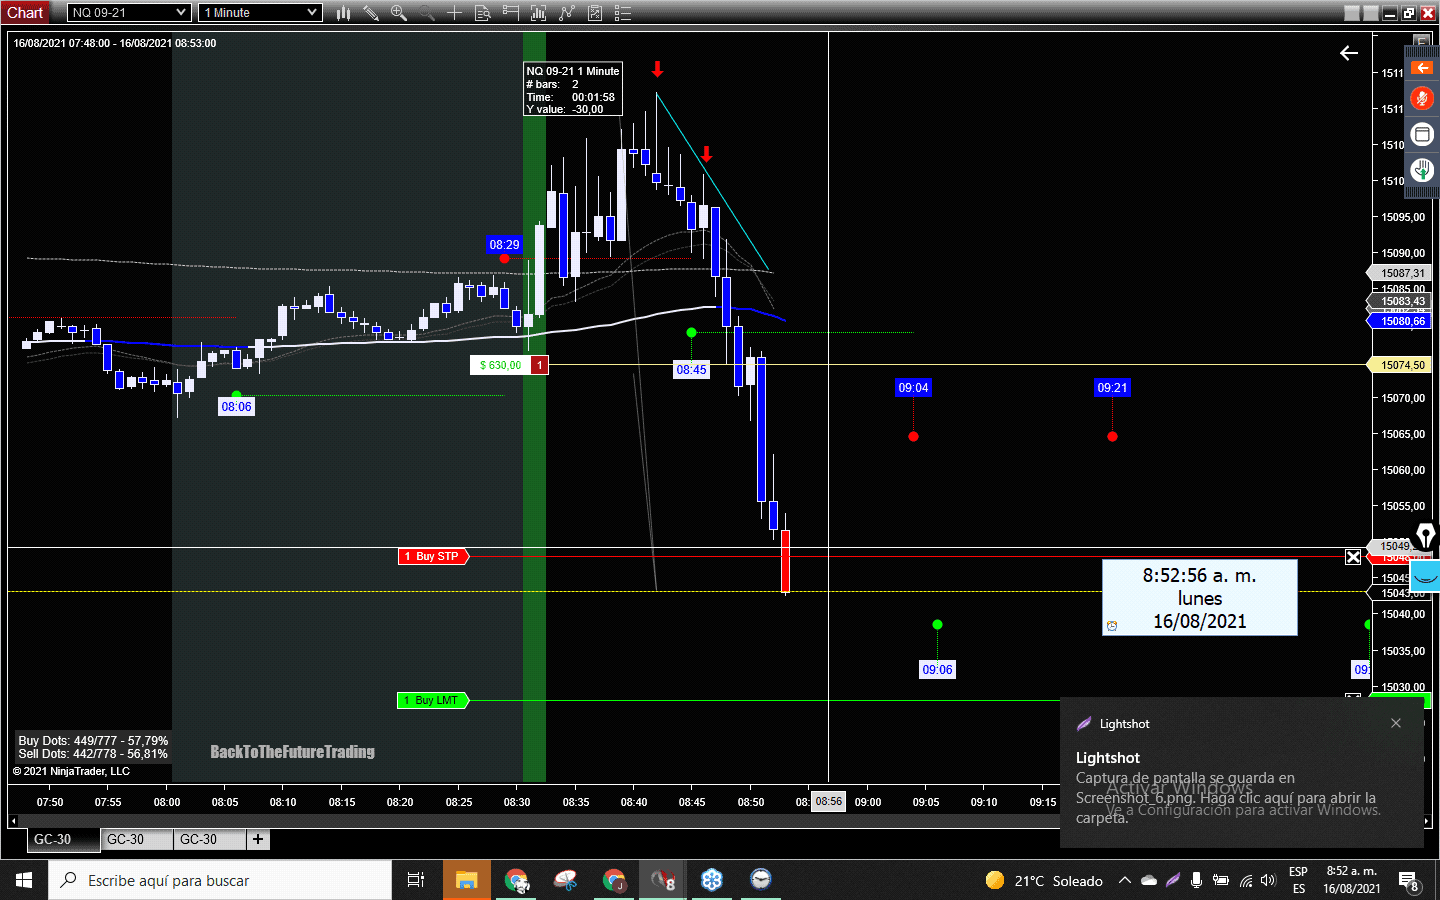
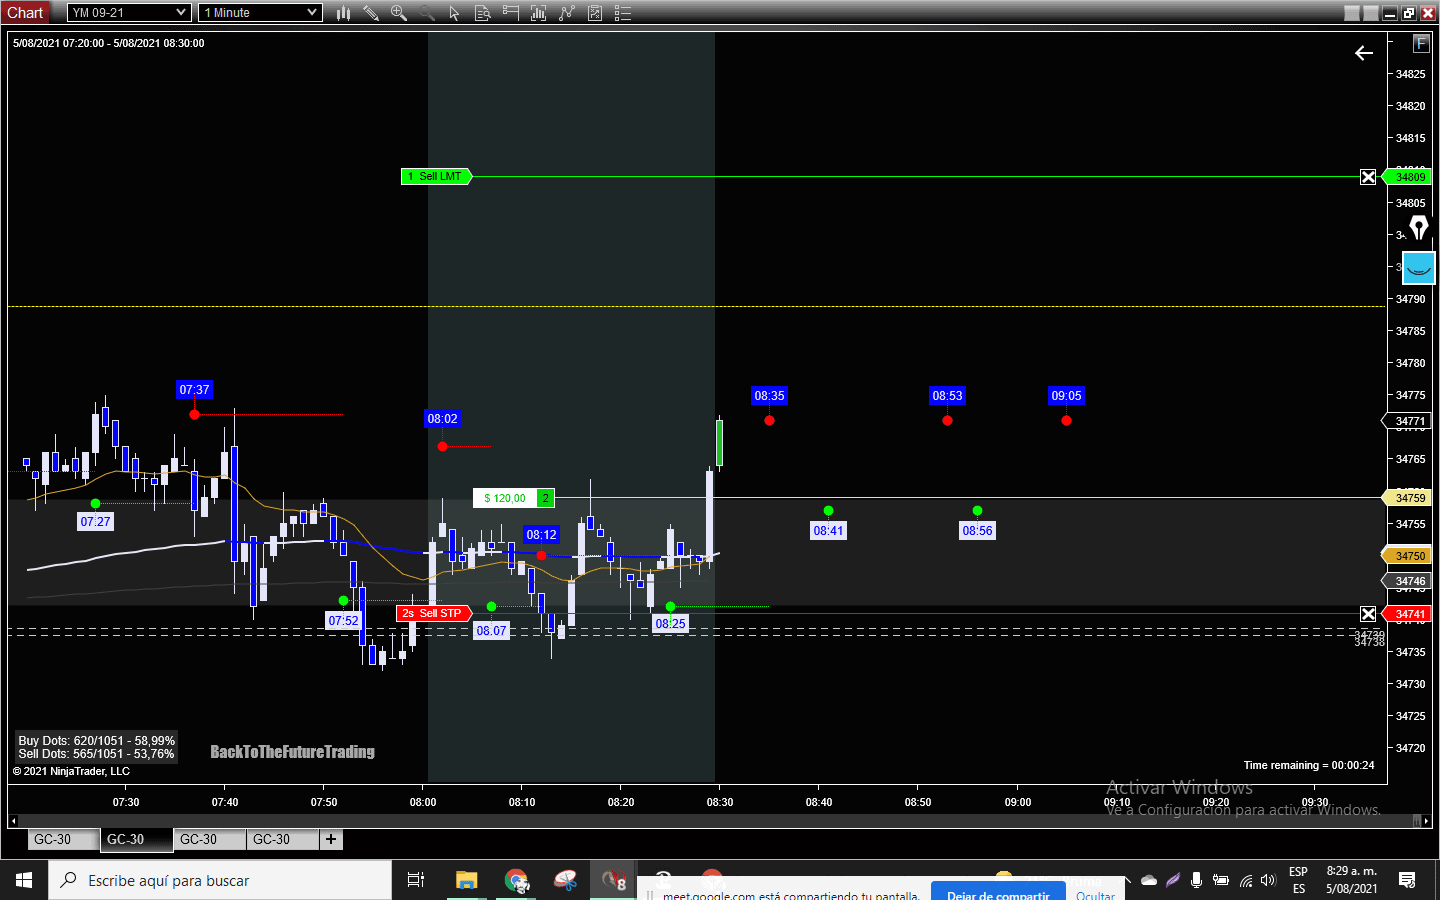
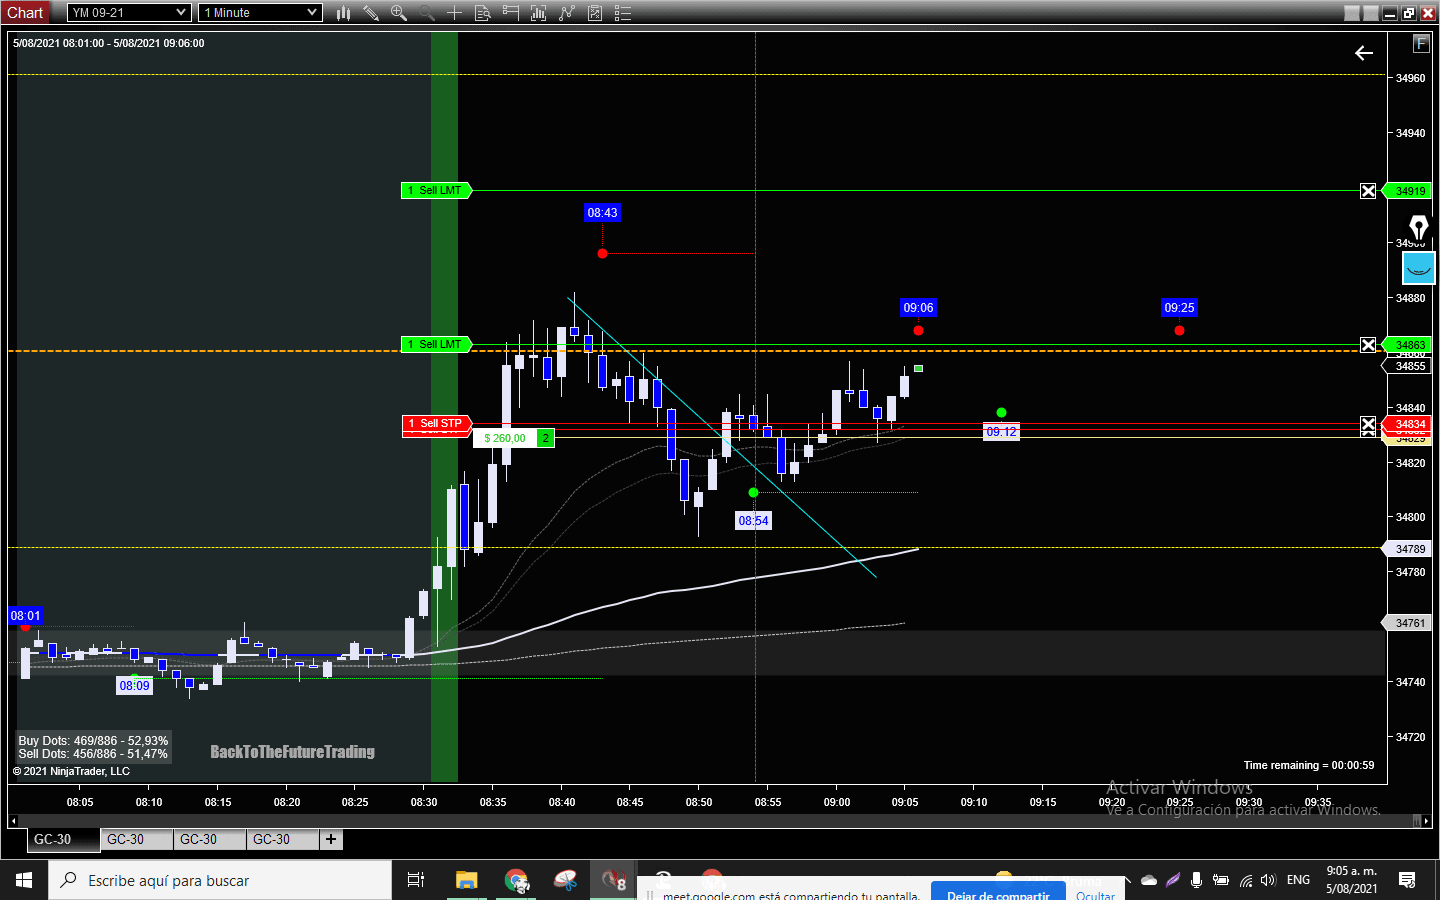
For today Emini S&P Trade, we are going to analyze one trade that I avoid, then wait to get more info and then open mi first trade.

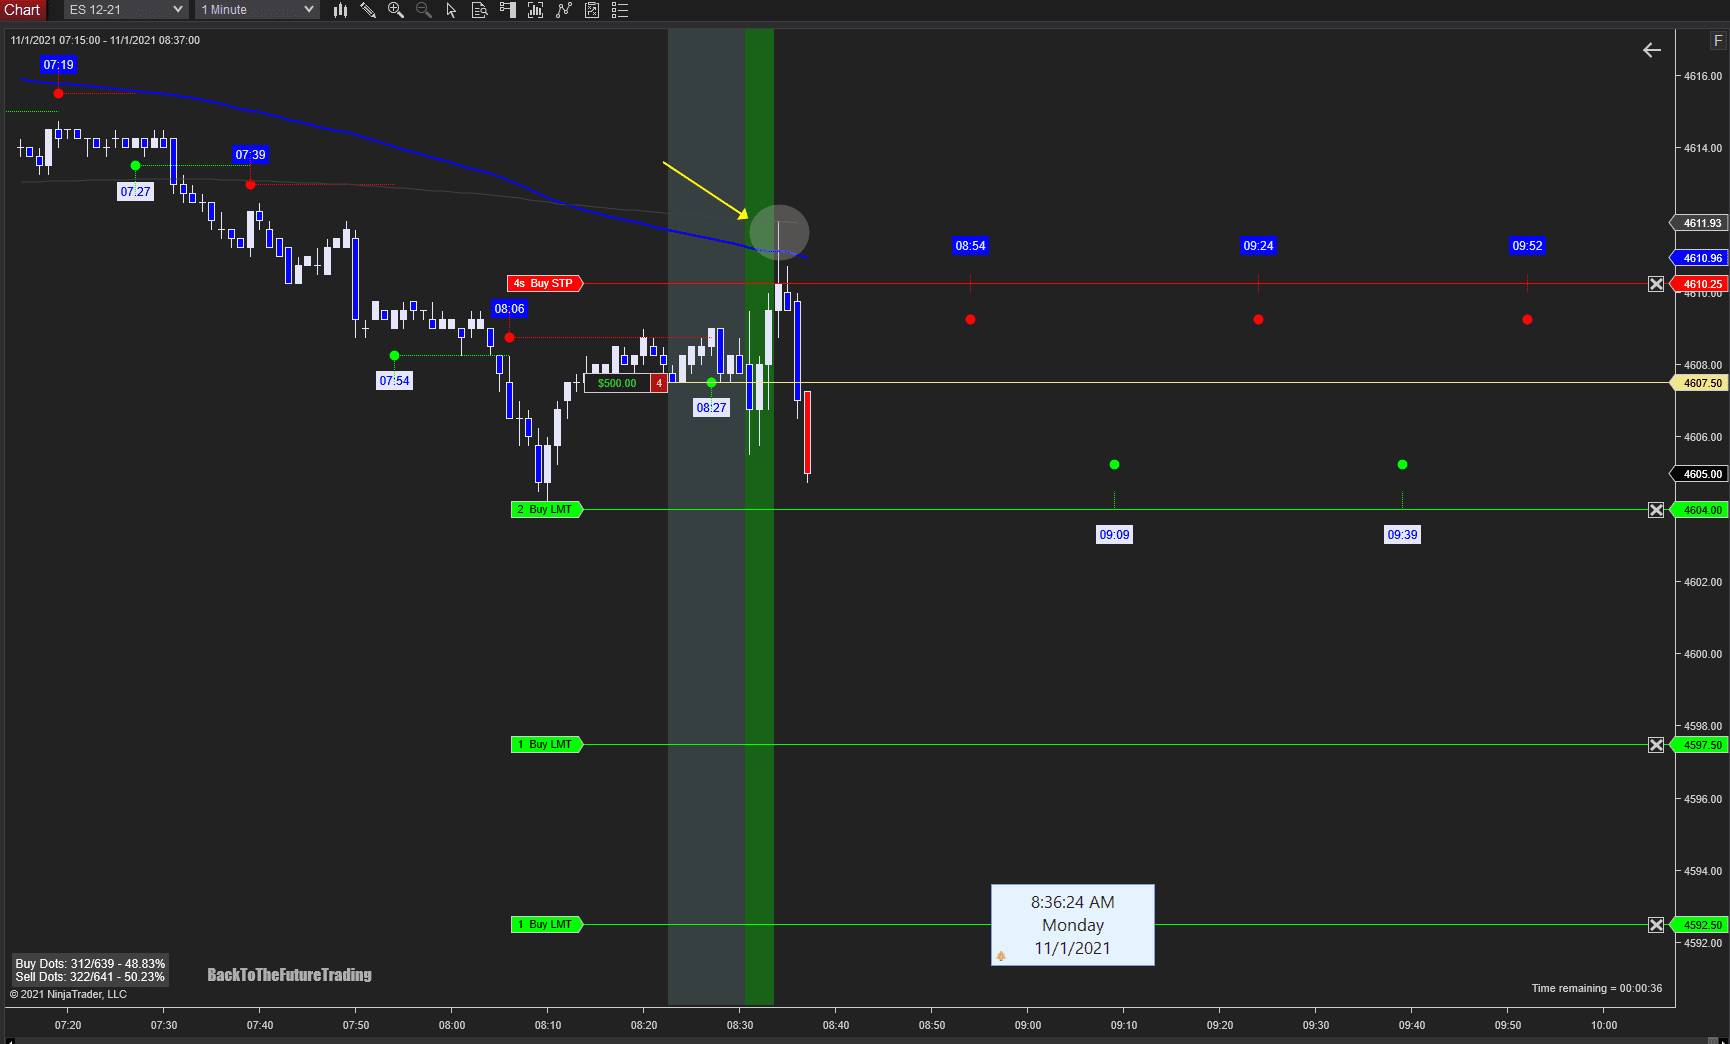
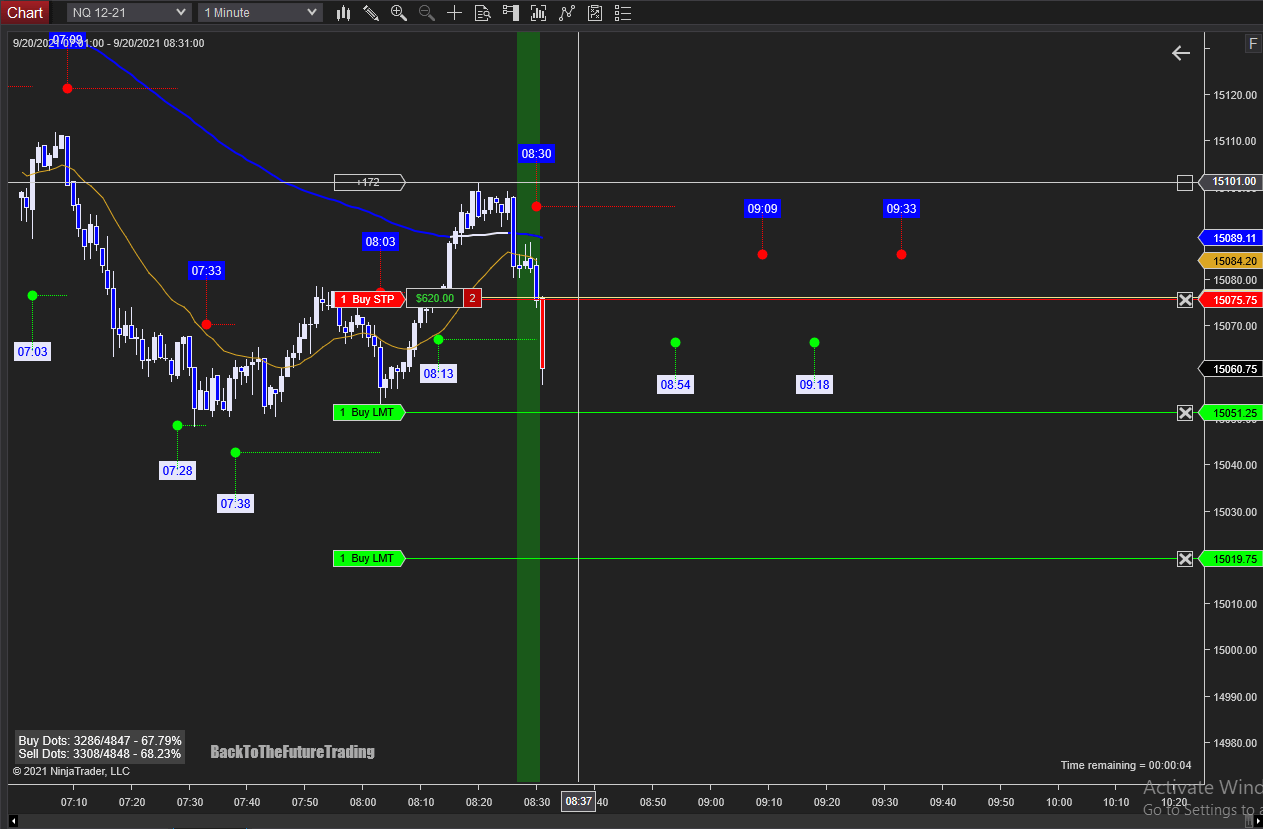
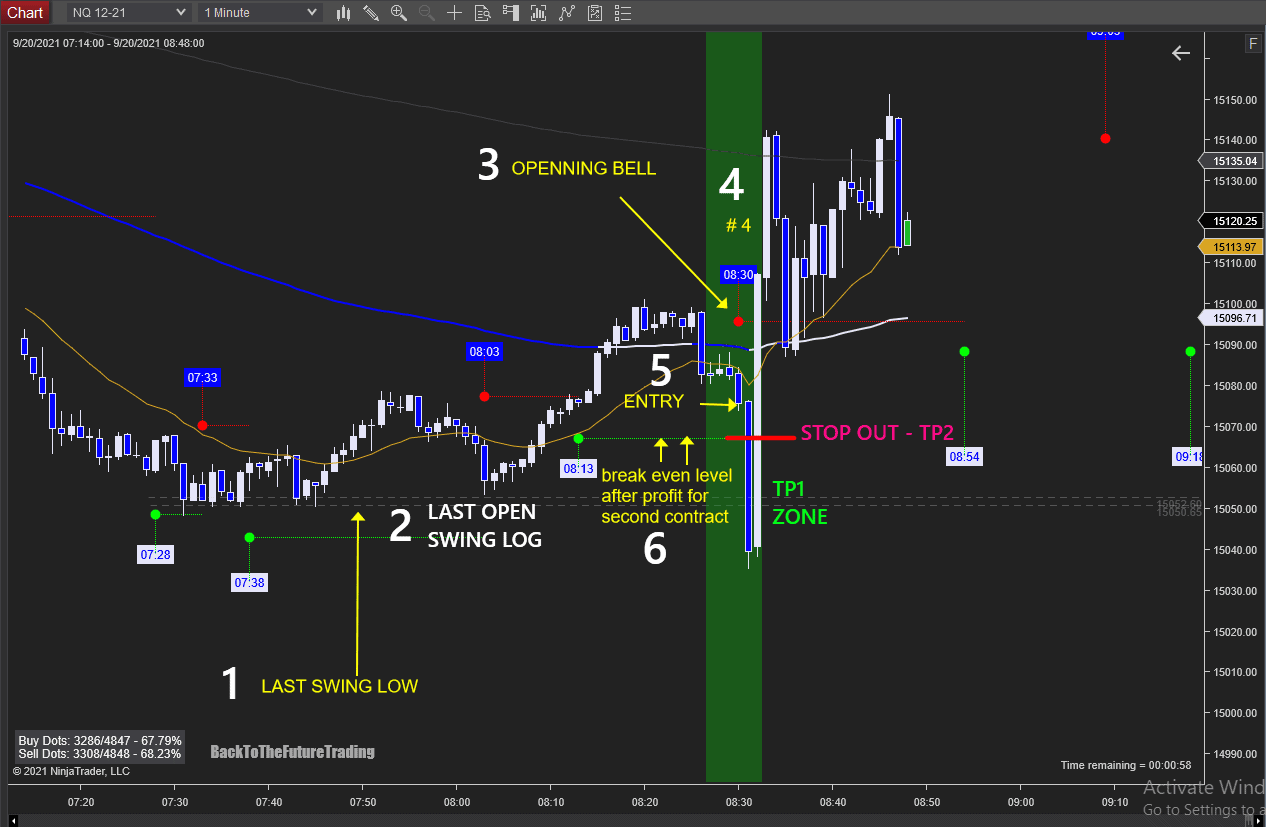
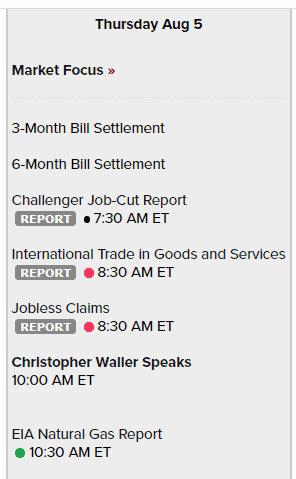
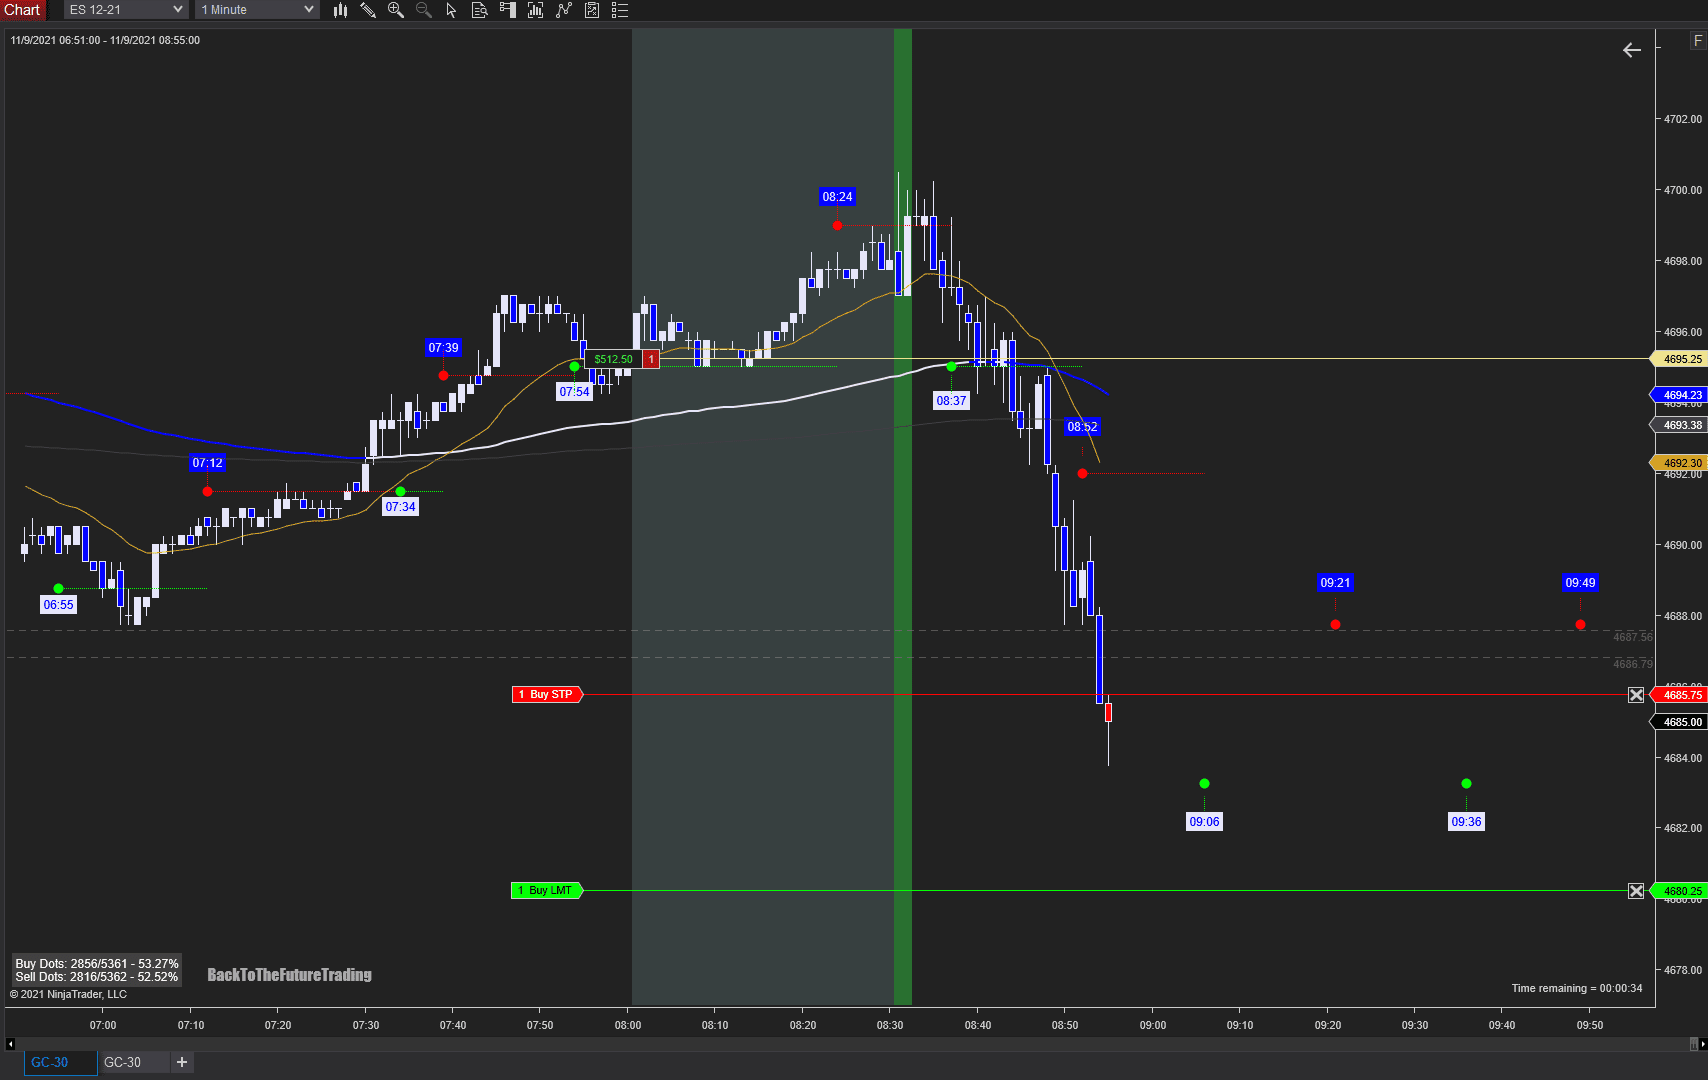
In the chart the vertical green region is the opening bell. At 8:37 am we have the first BUY pattern, and I didn’t take it. Why? Look the 8:24 am time stamp and the red line plotted by itself. At the opening the price couldn’t cross above that line forming medium wicks in the candles. That’s a good resistance level (White square). The candle at 8:37 is closed with a big wick, making me think that a reverse could be come.

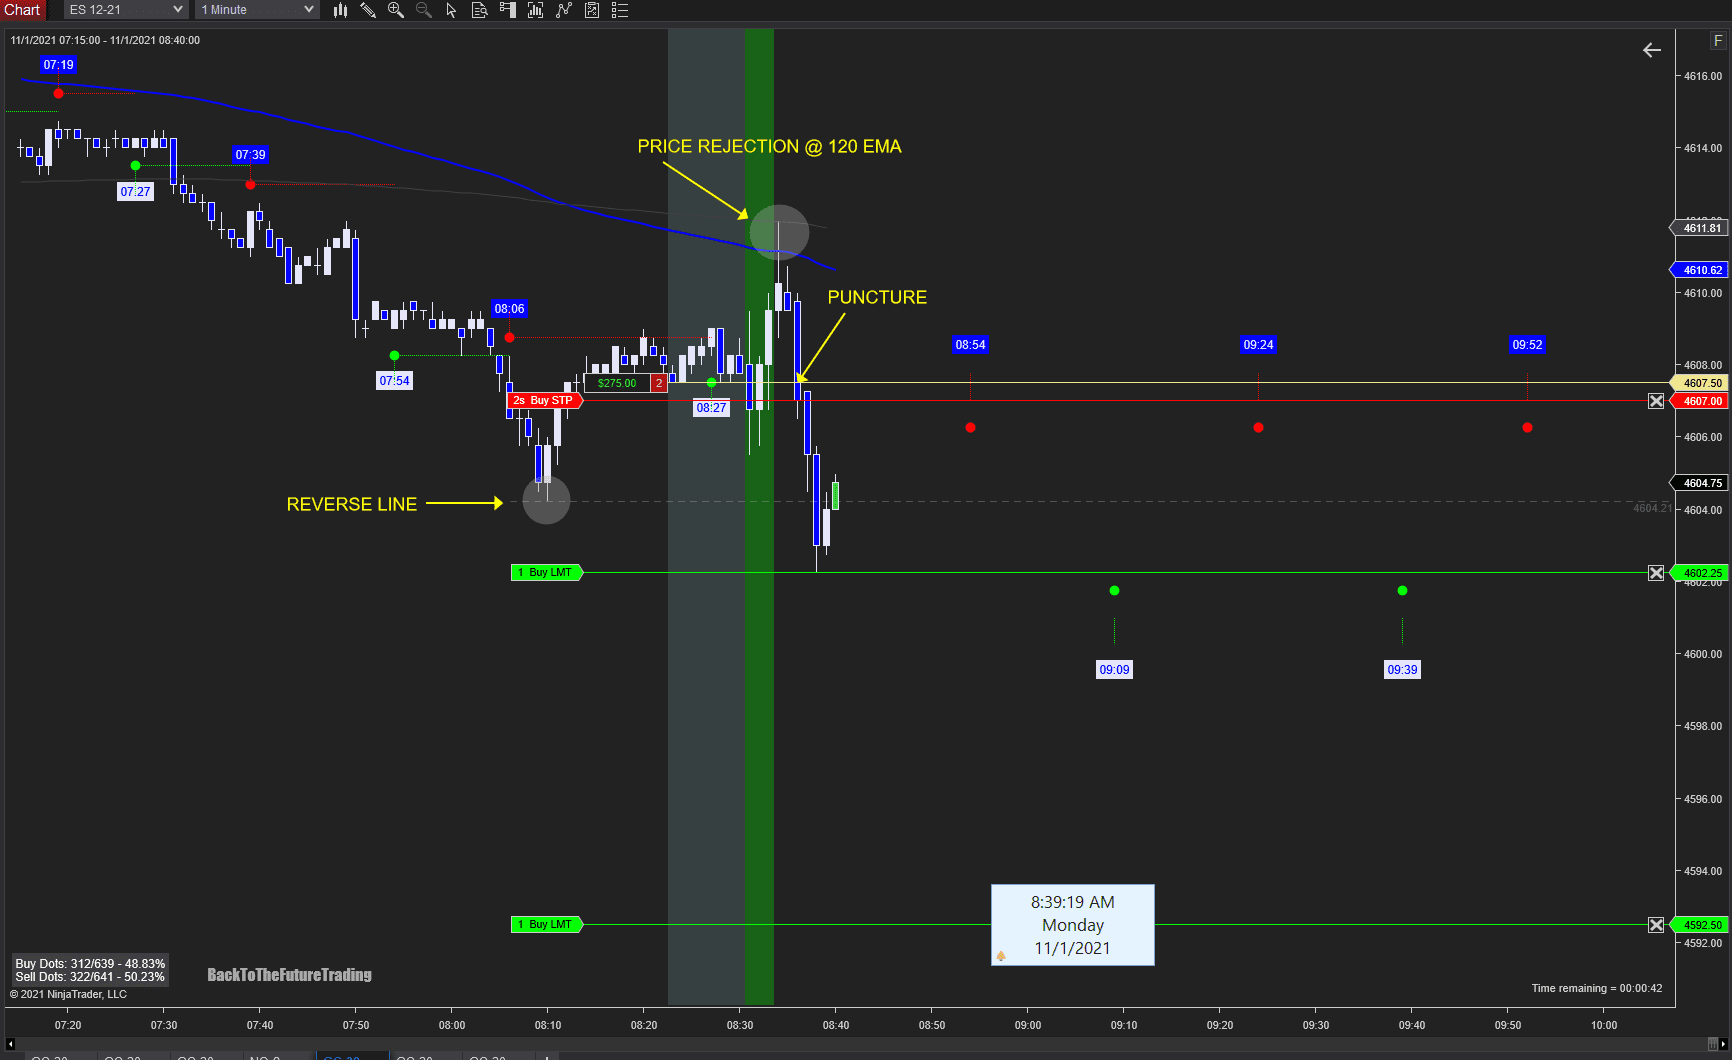
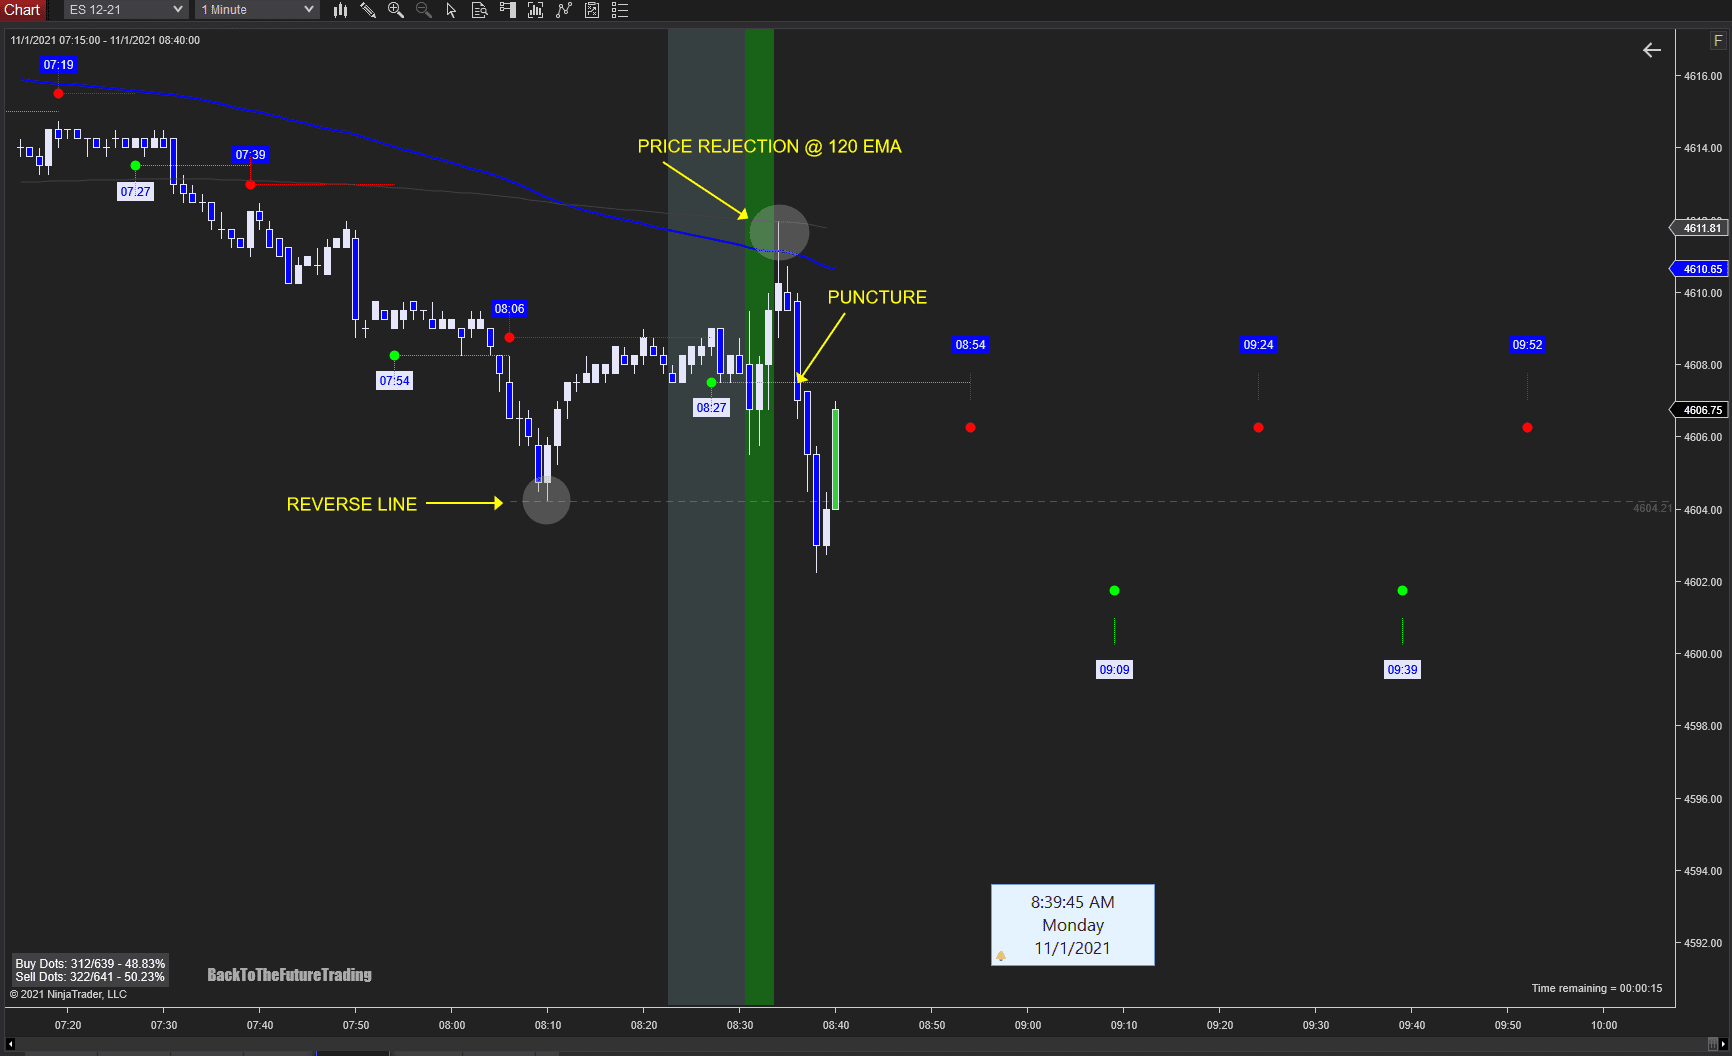
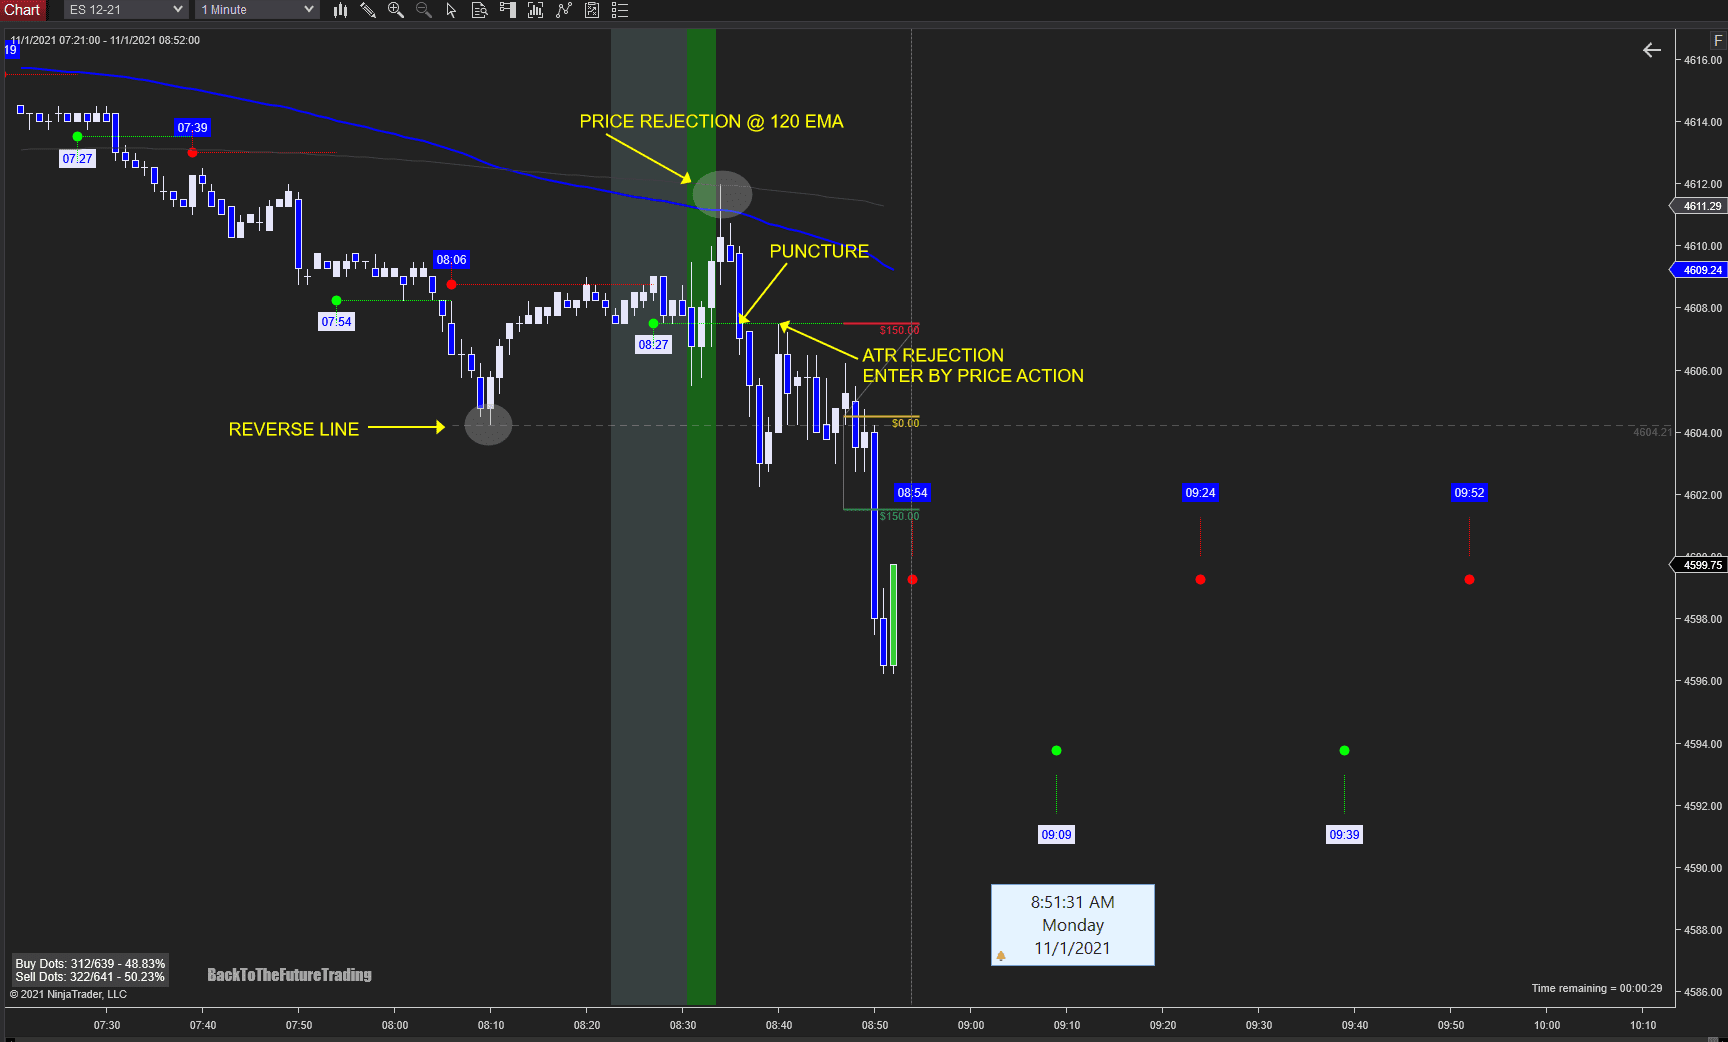
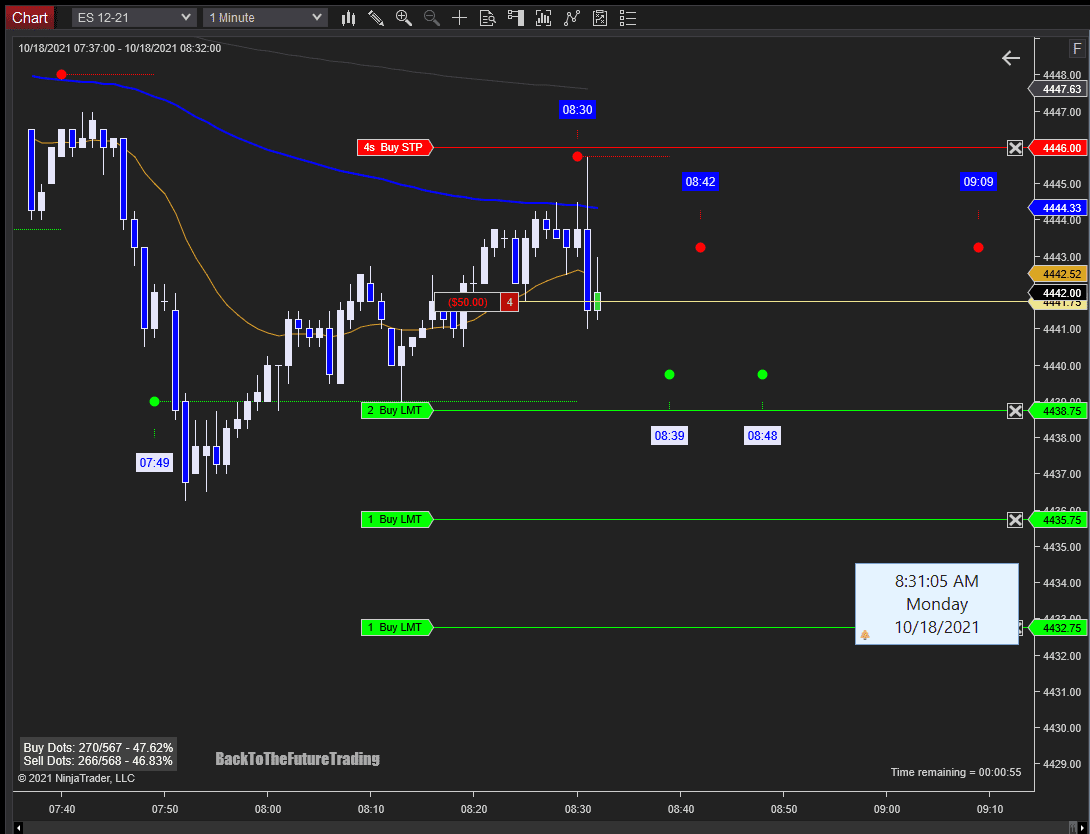
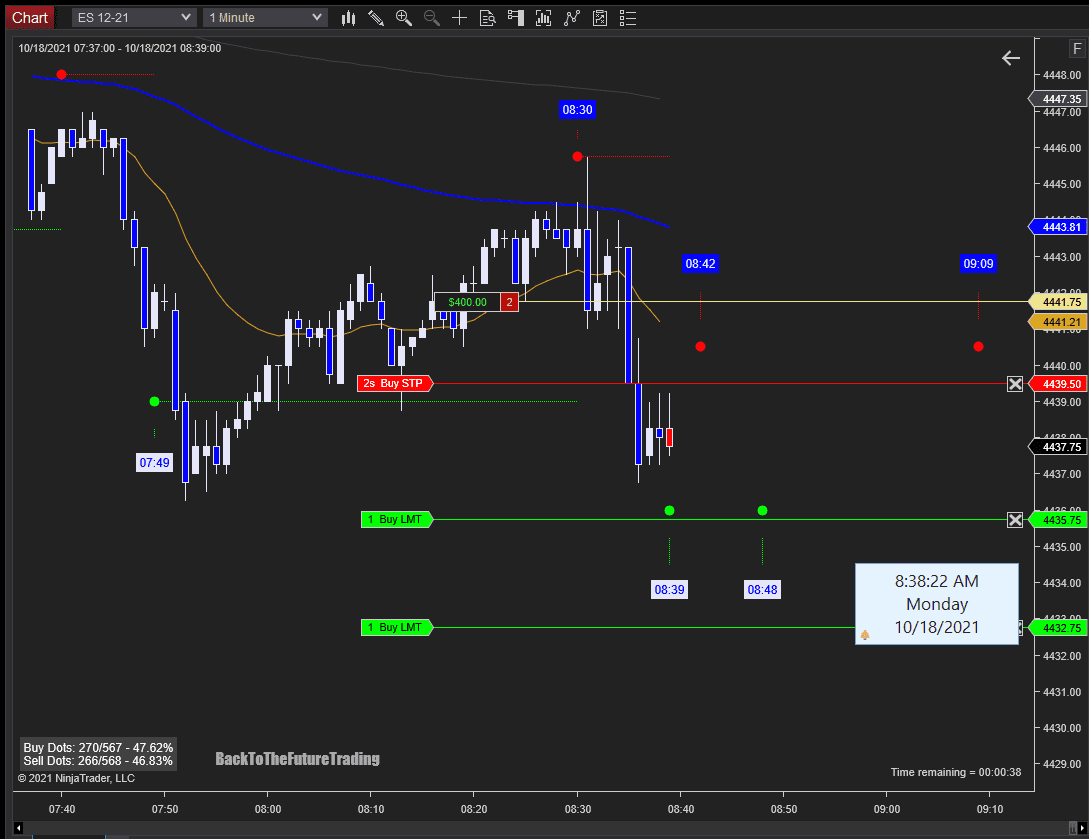
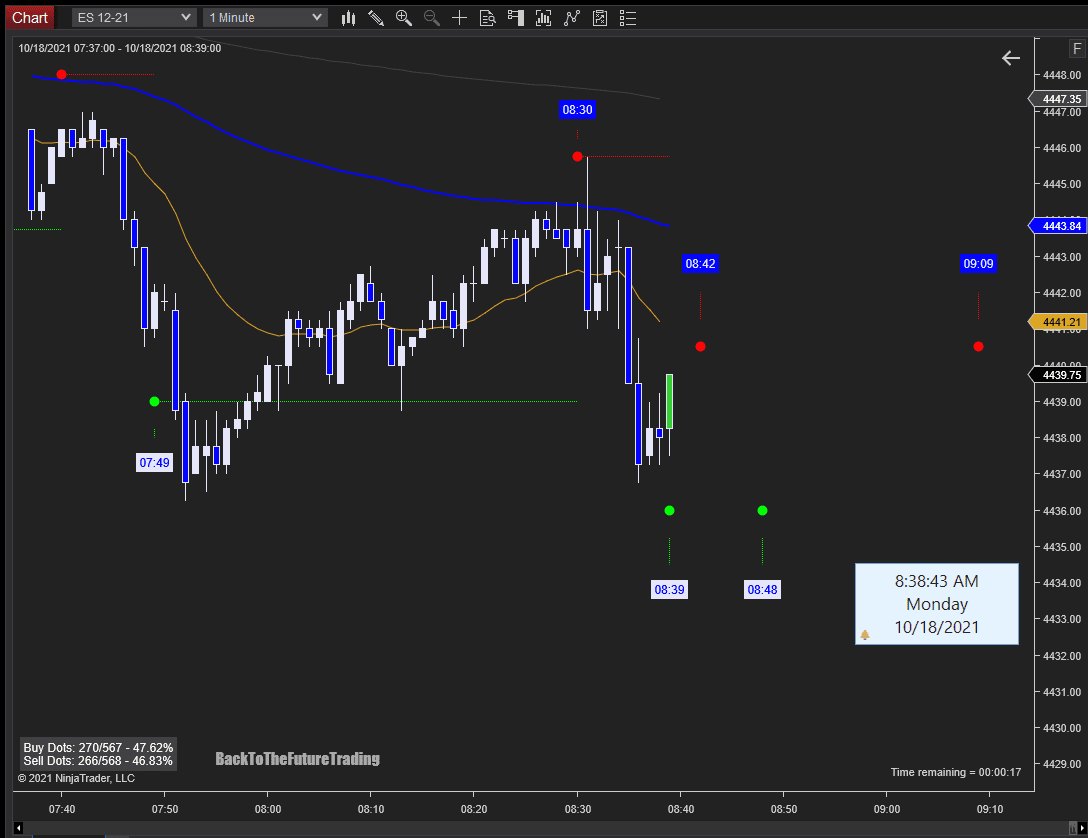
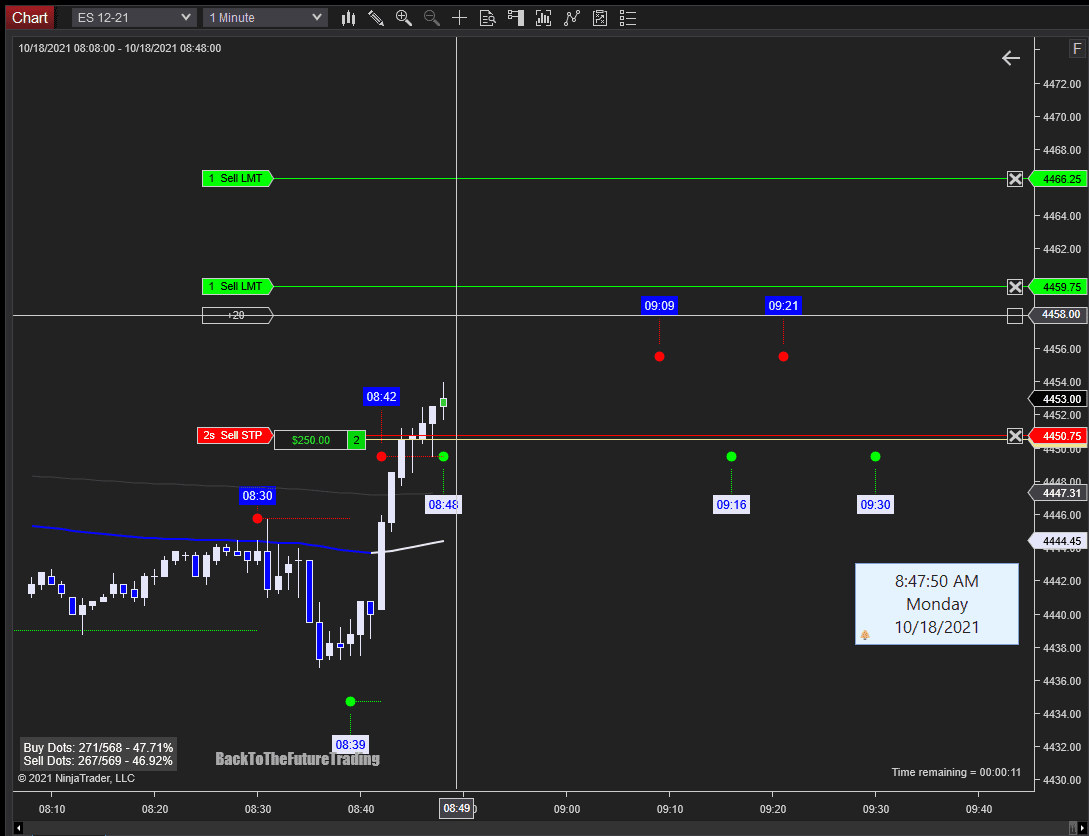
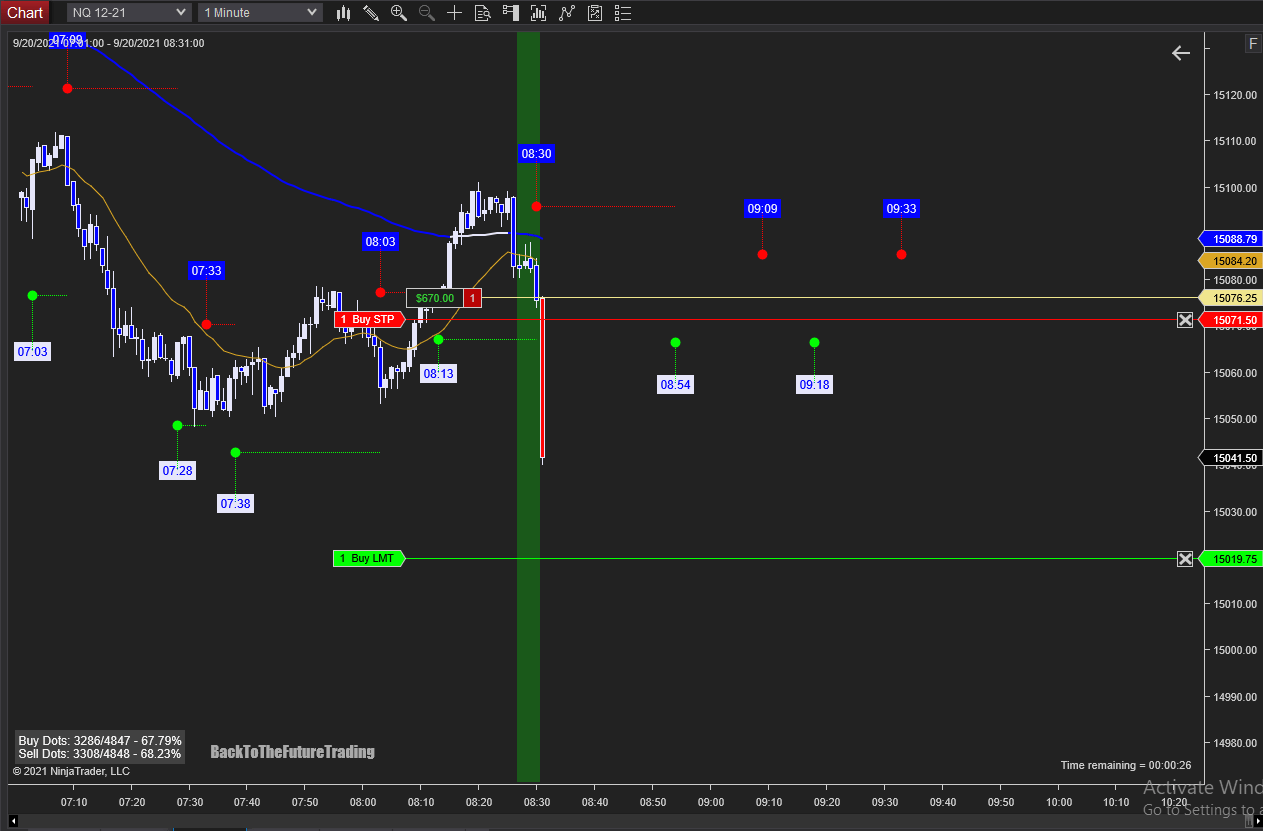
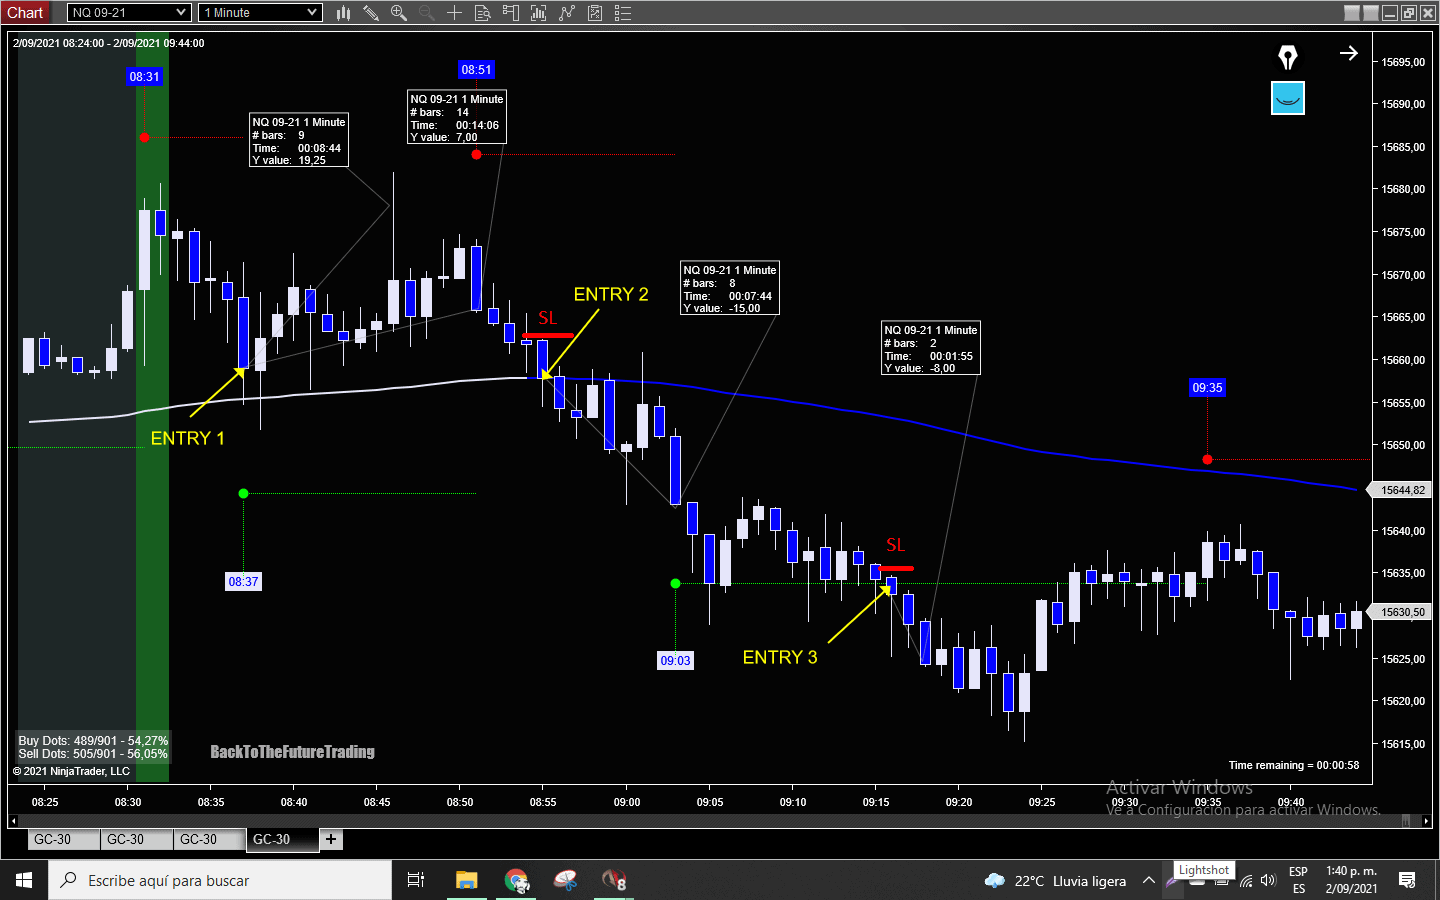
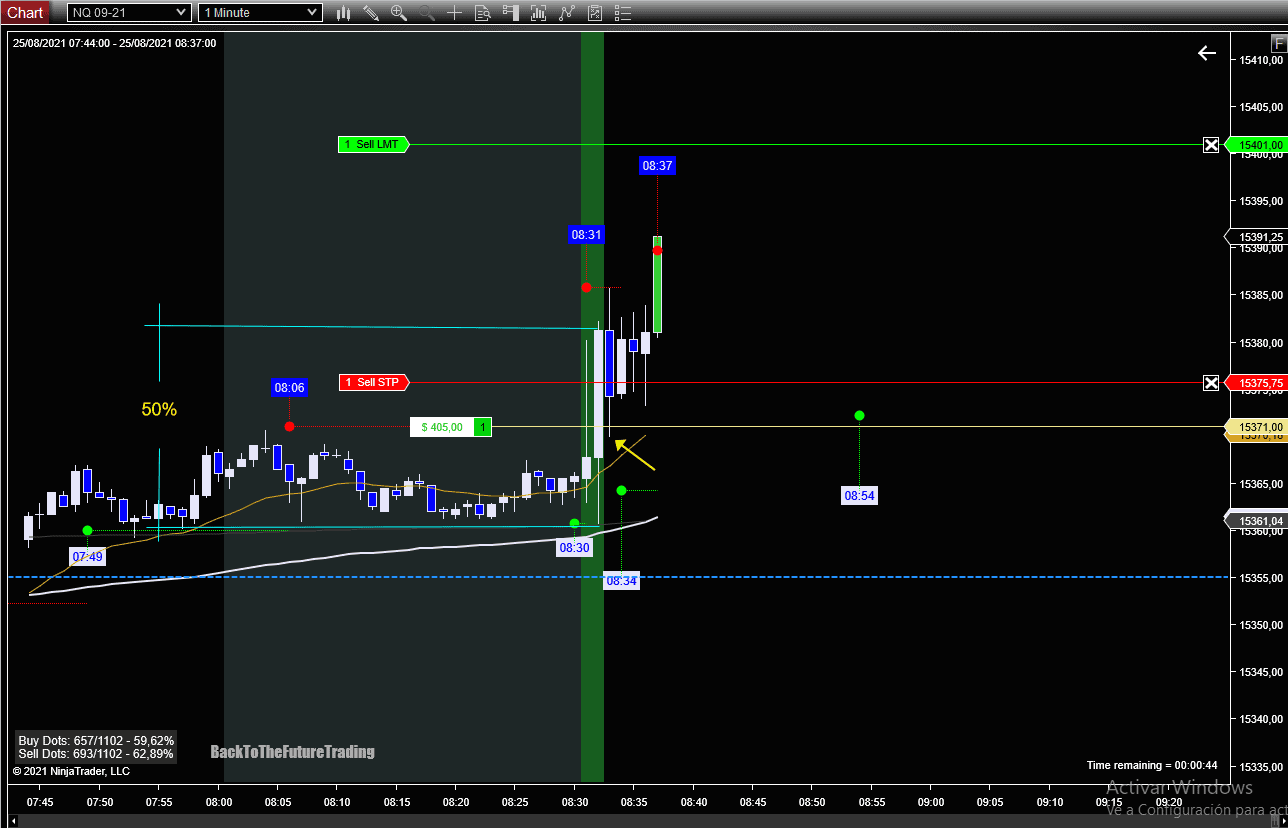
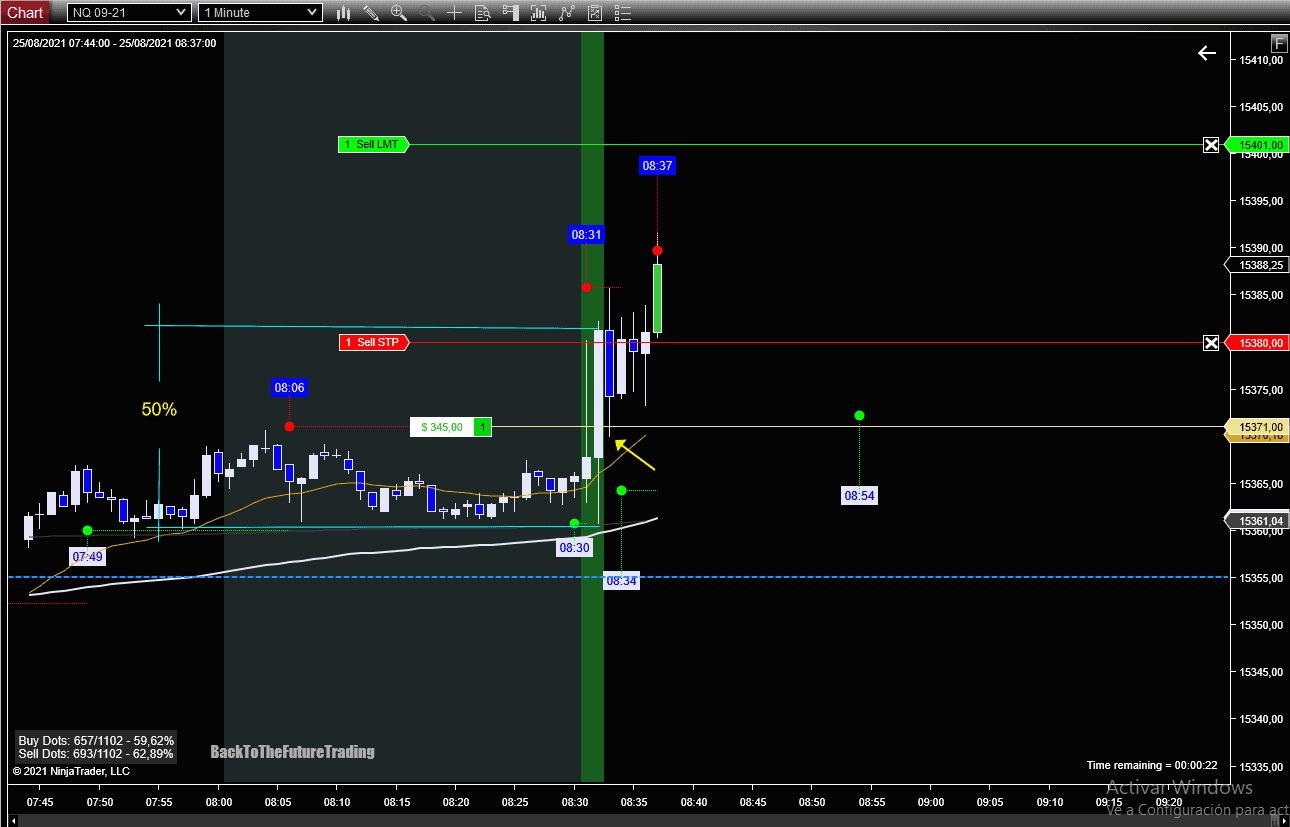
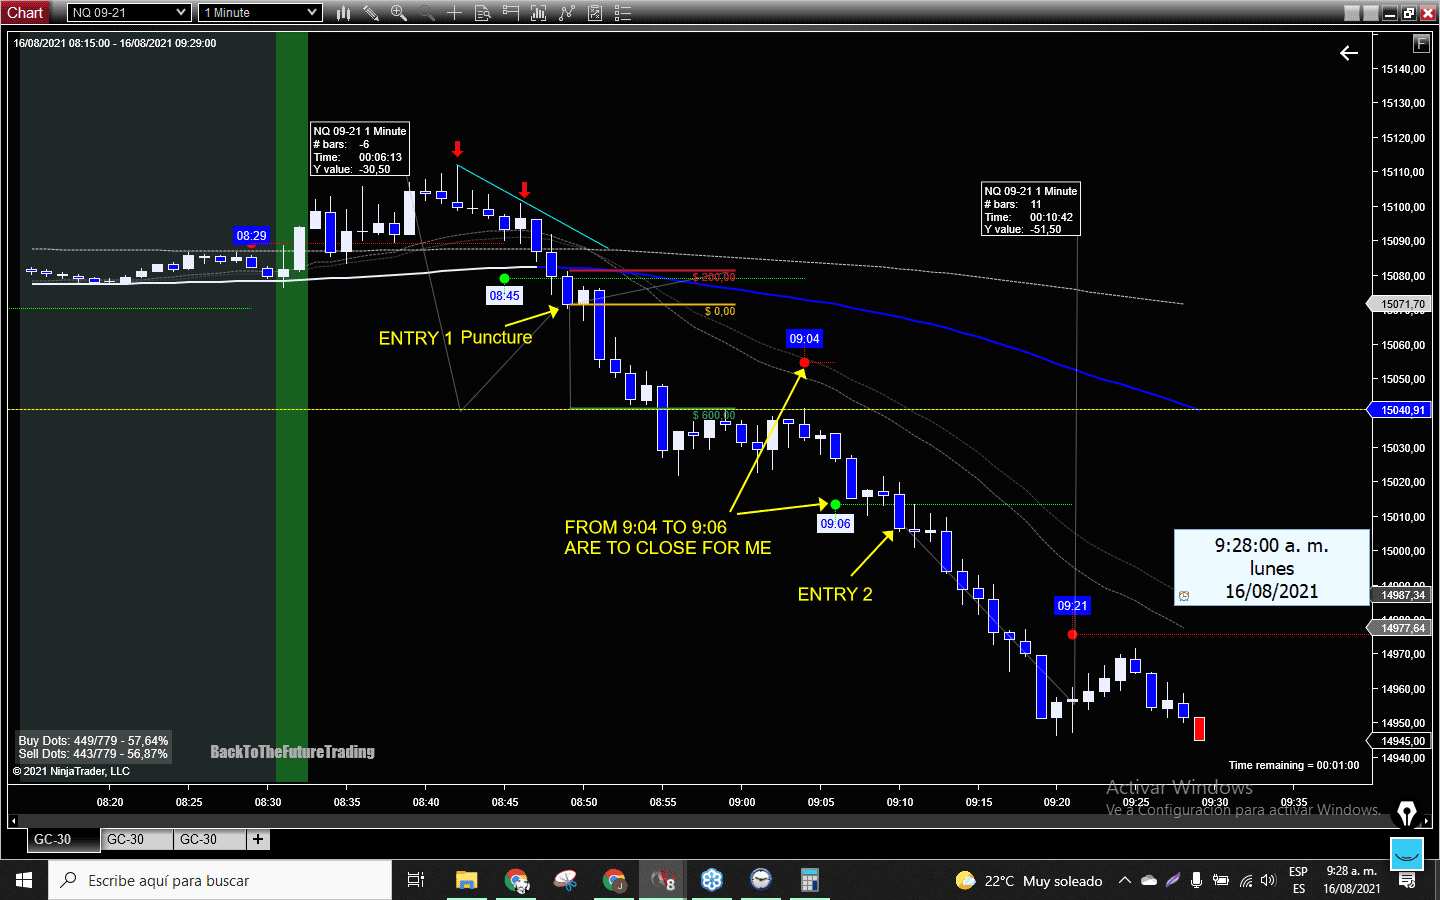
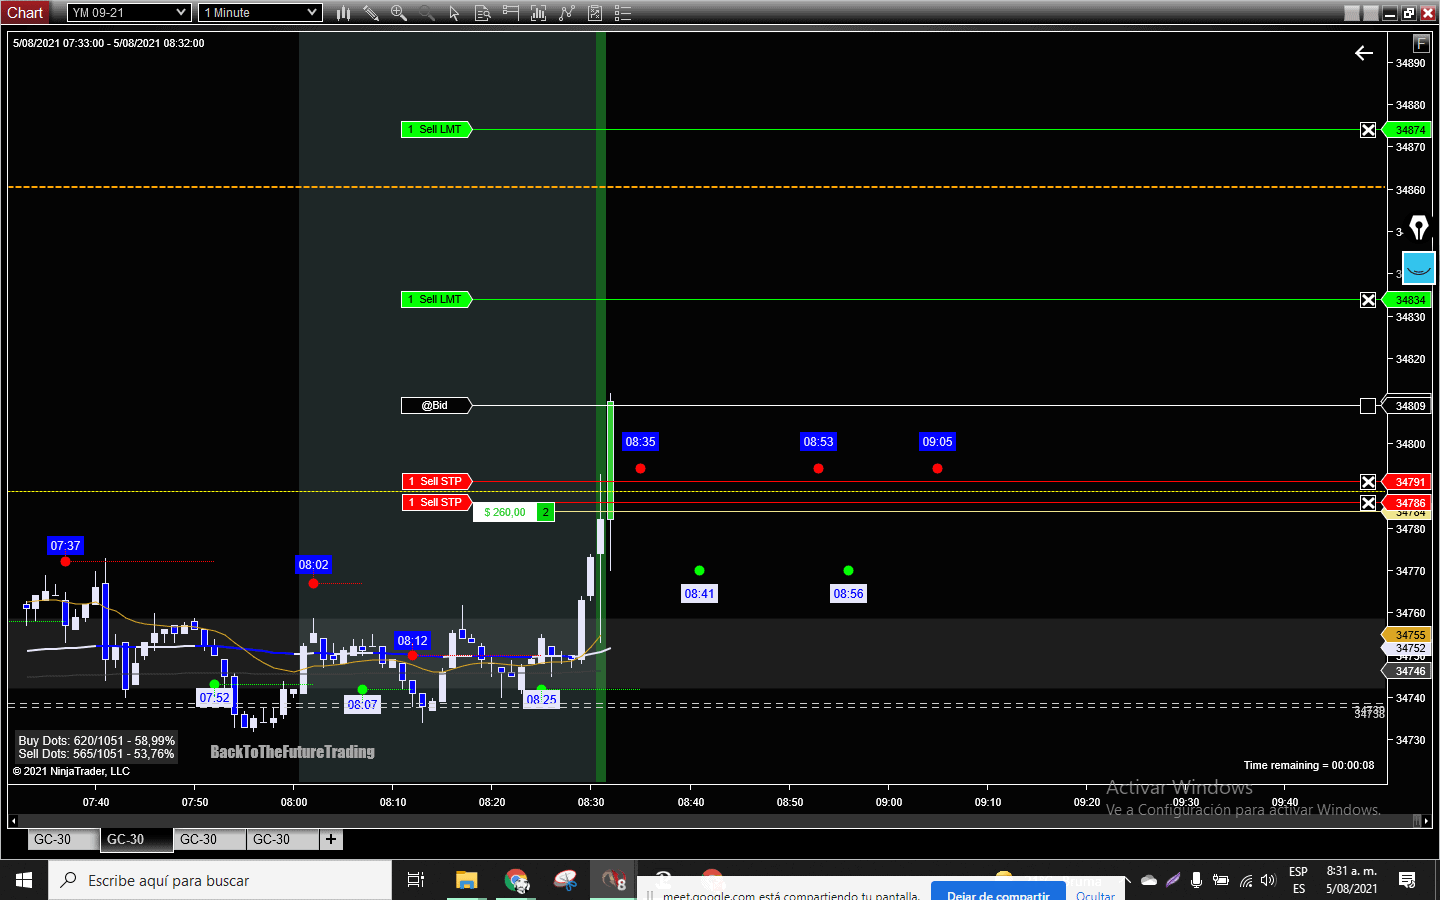
The price makes the first crossover at the 120 EMA but does not cross the 8:37 level, I wait the second attempt trying to cross the EMA and the green price level, and I open the trade.

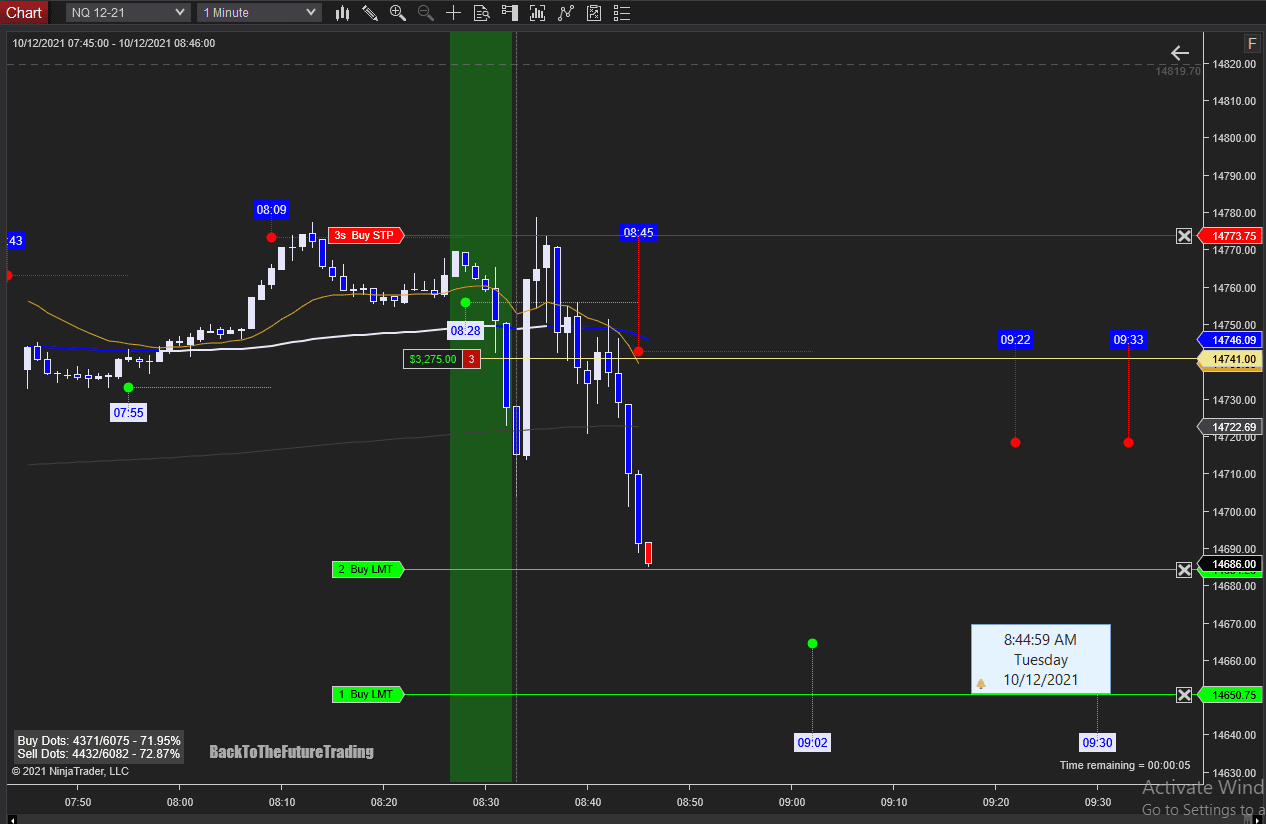
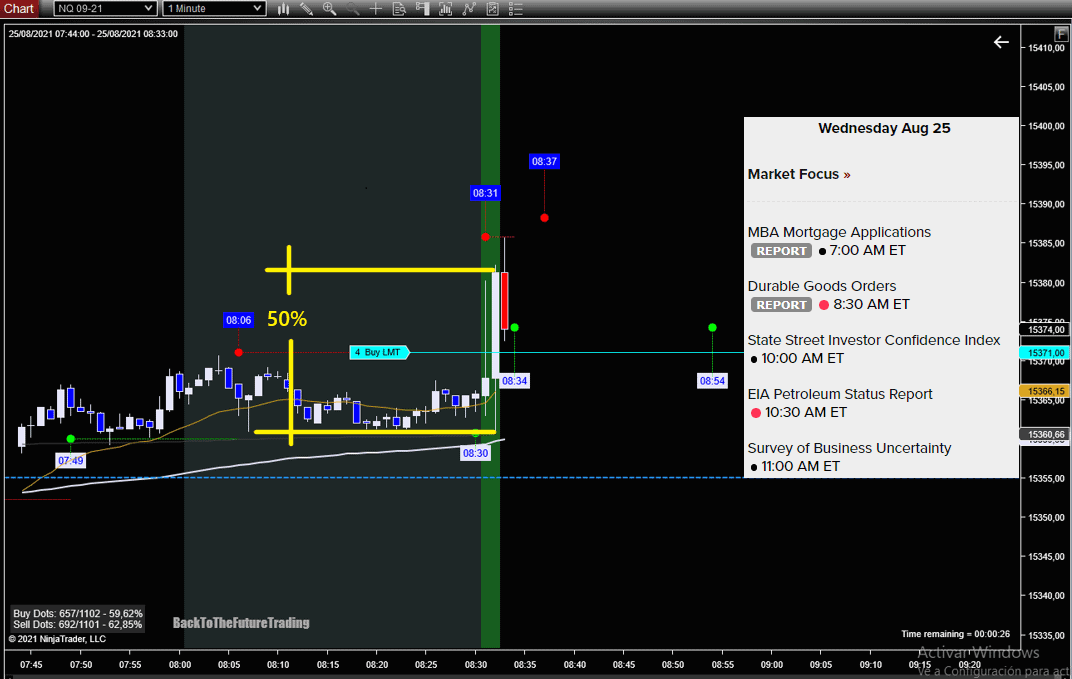
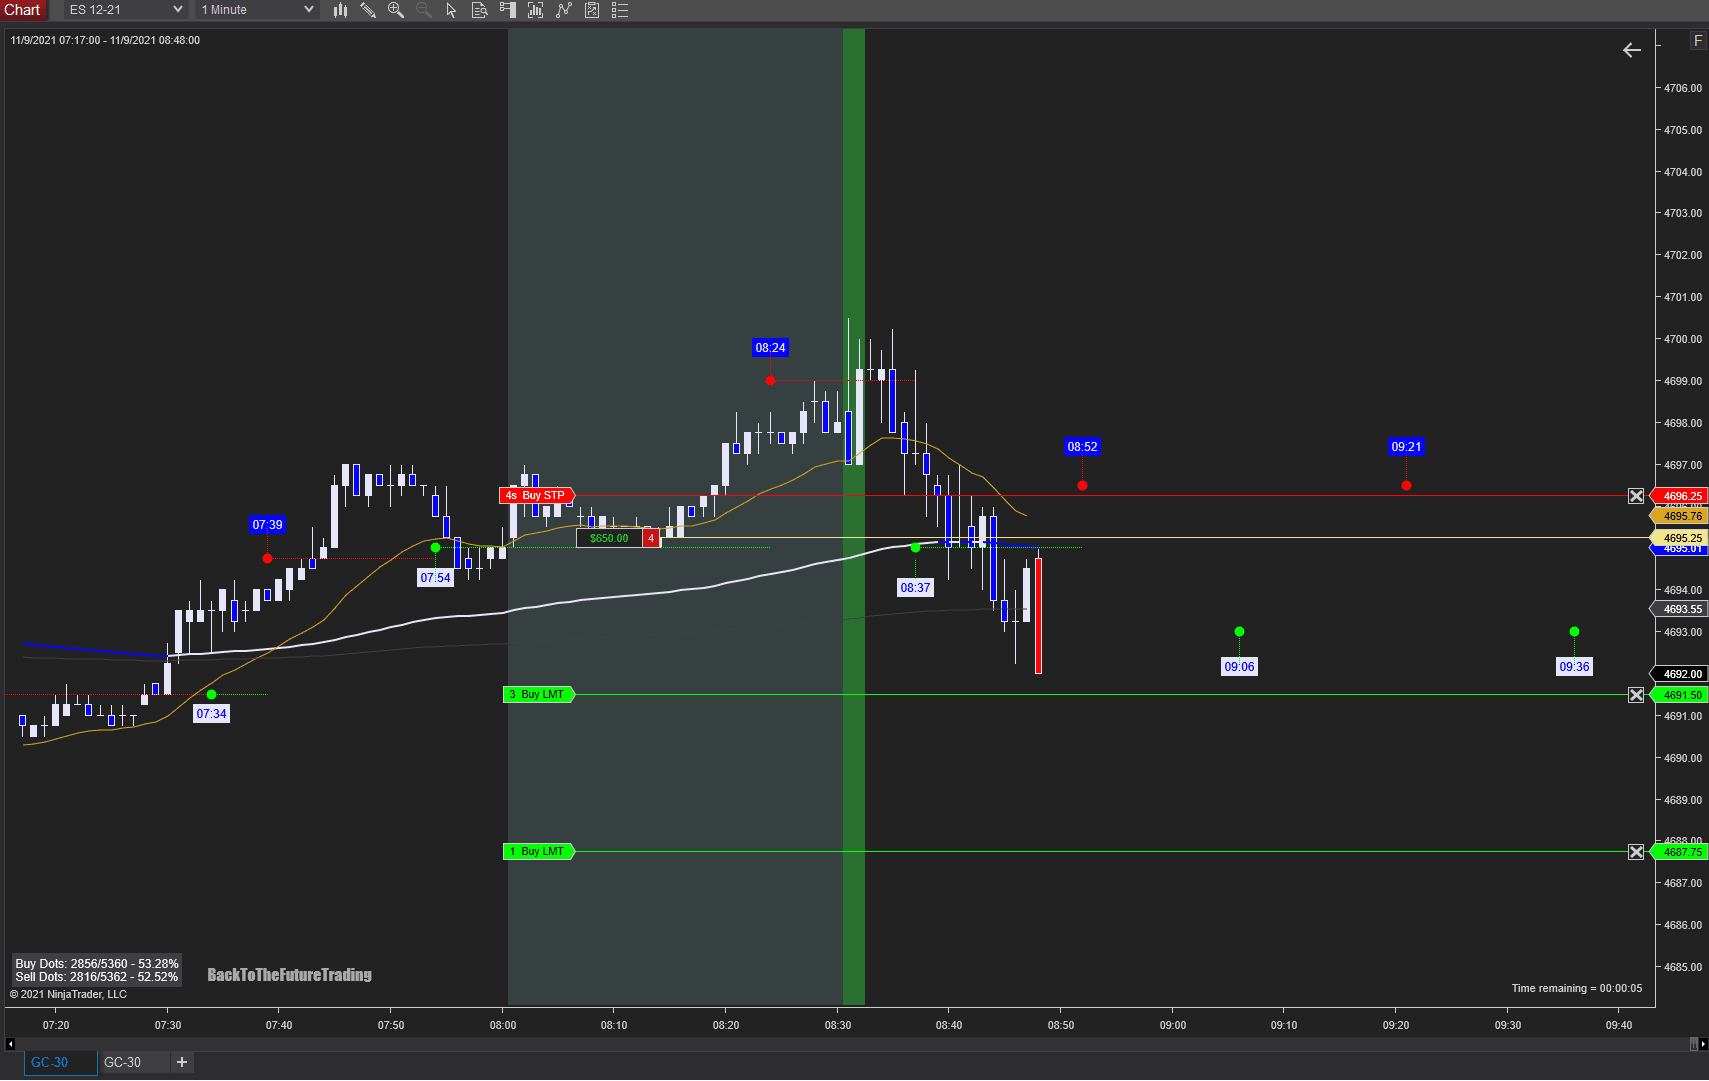
If you missed it, you could put a sell limit order at the middle of the third big candle (the one that crossed both levels) in the middle of it or the 50% of his body.

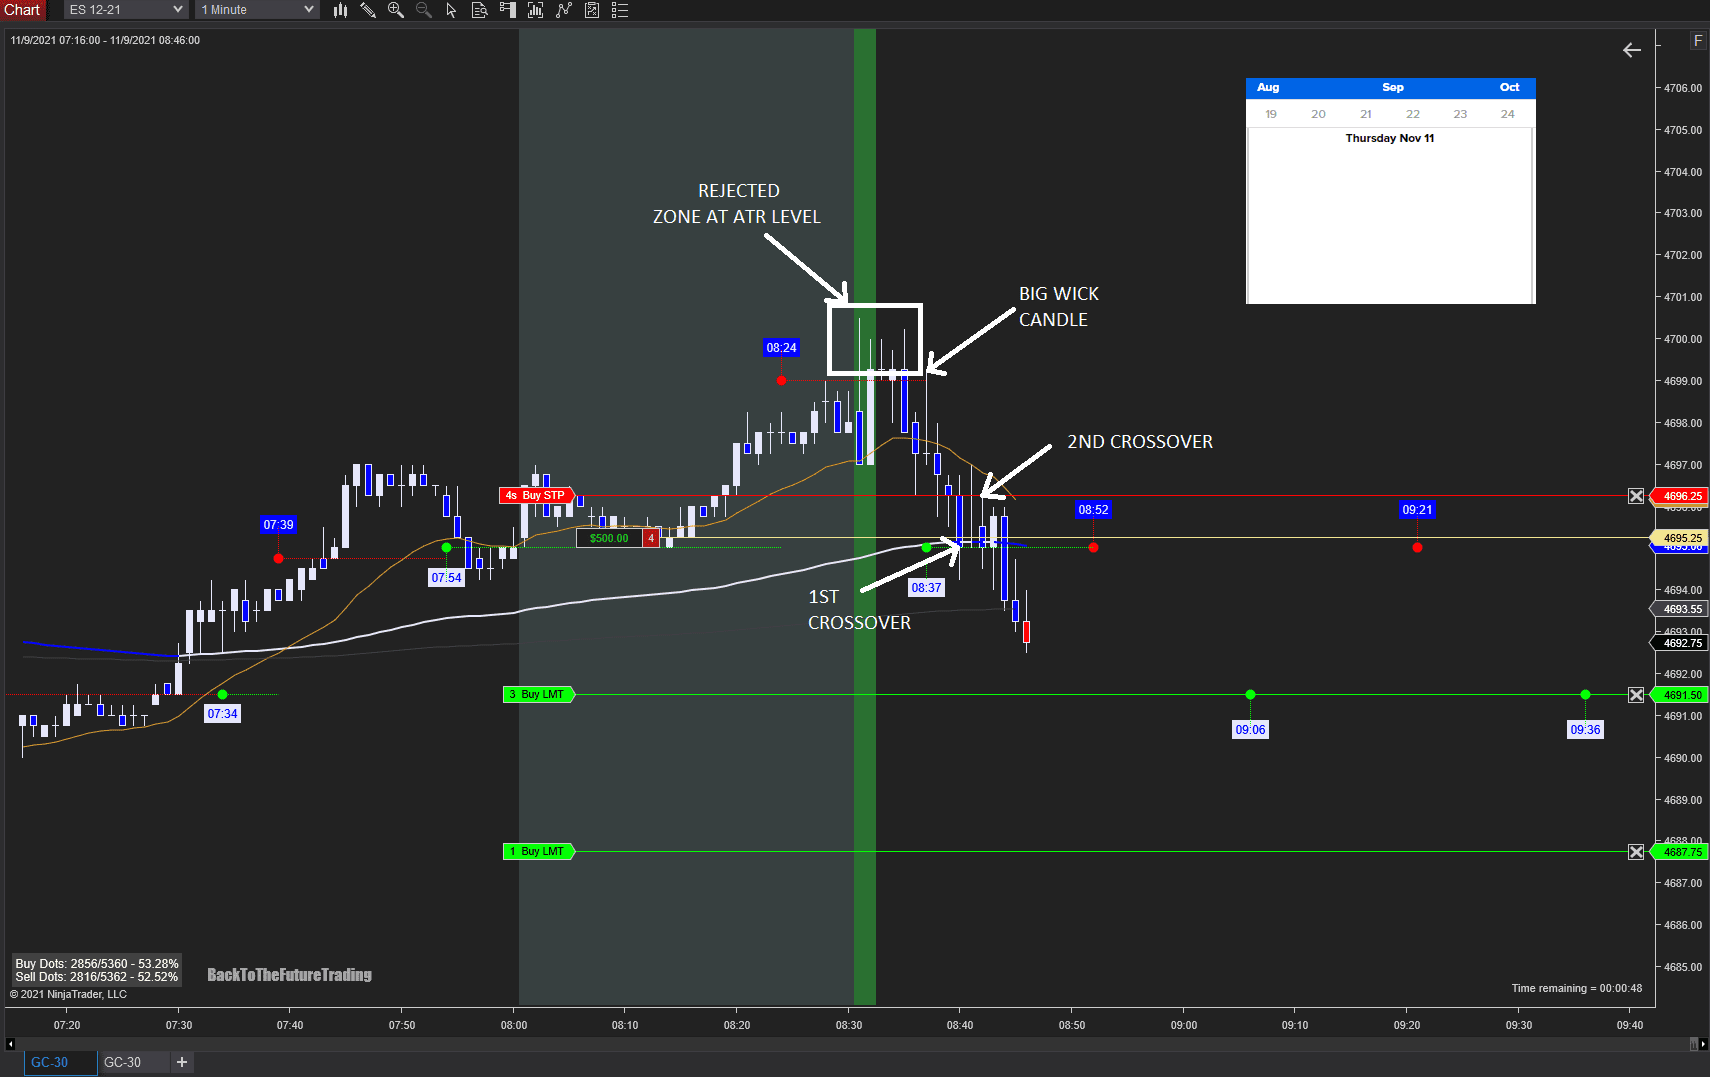
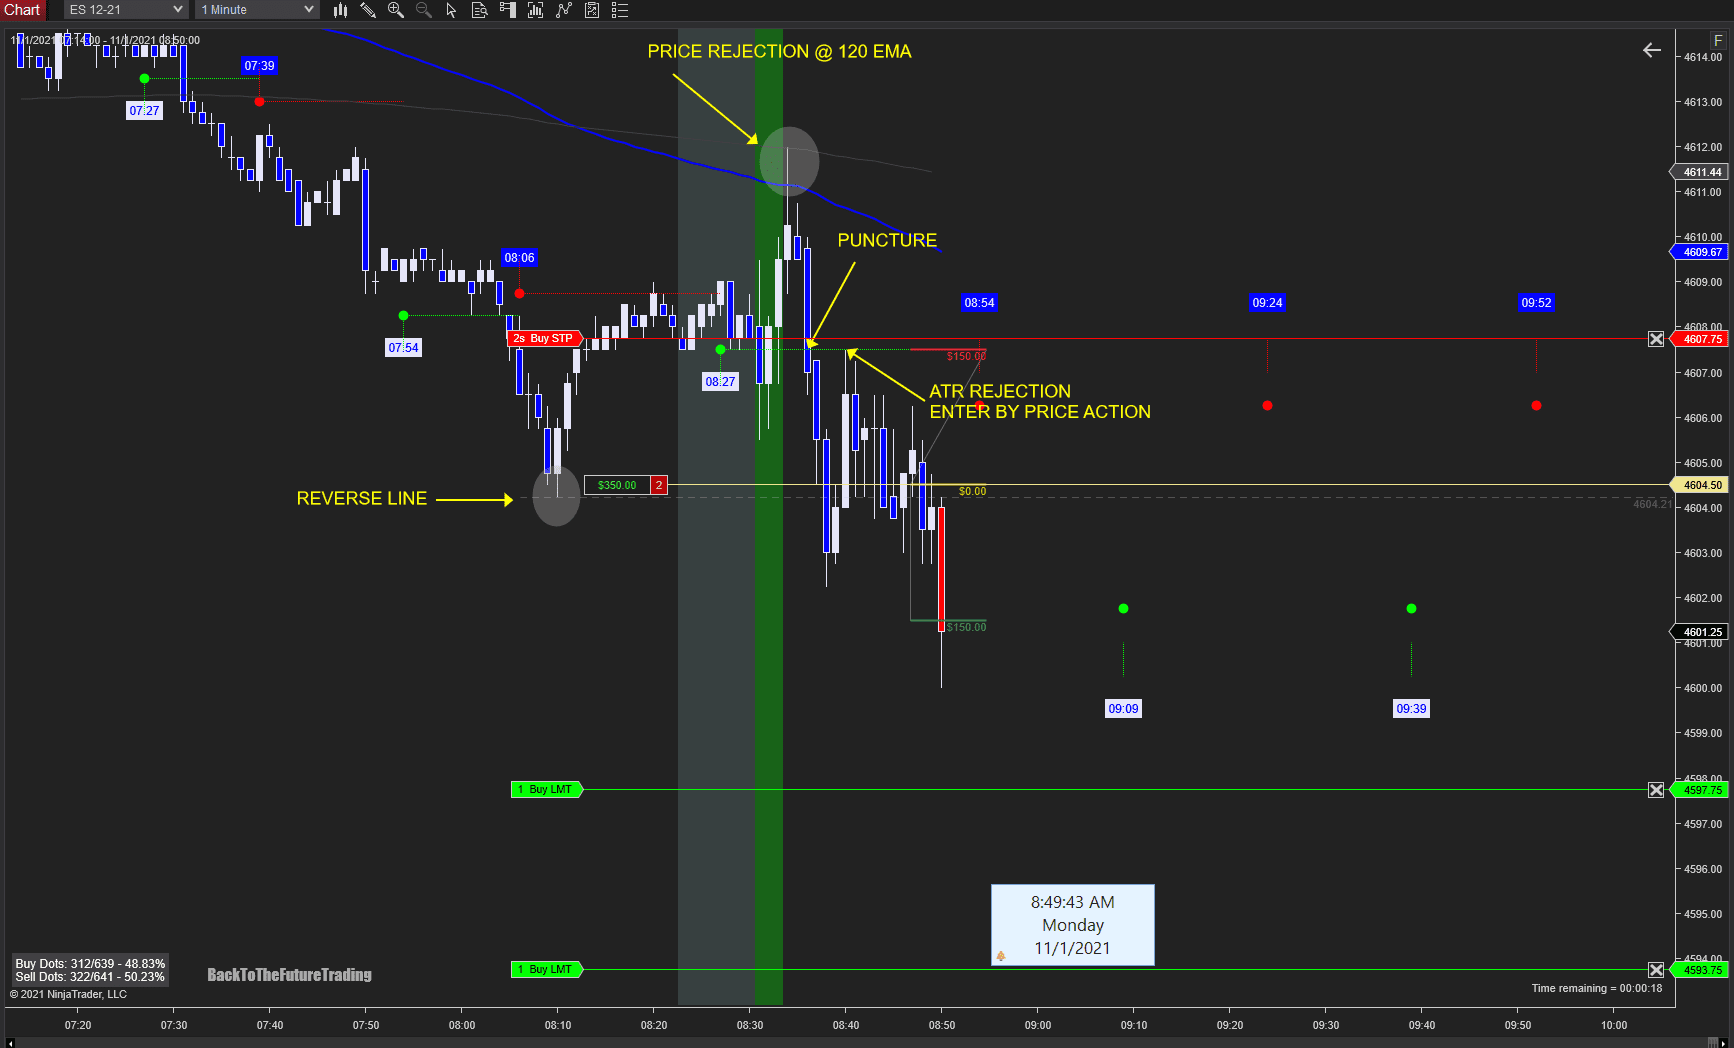
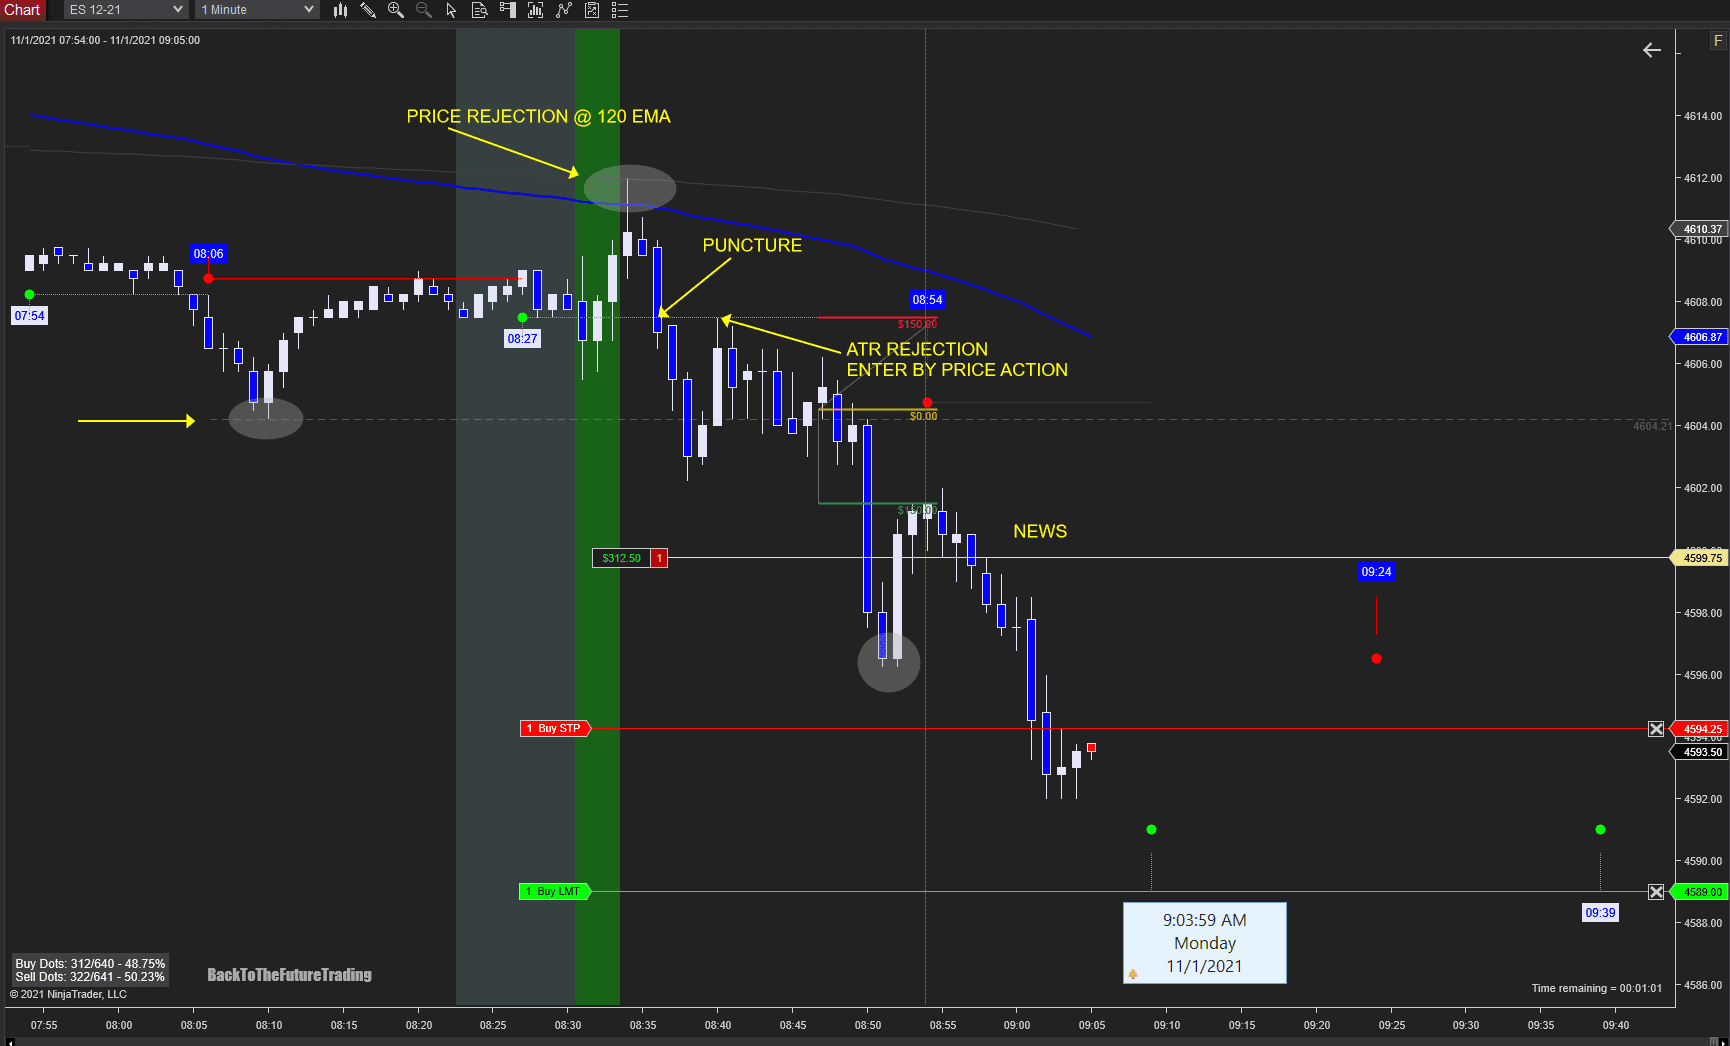
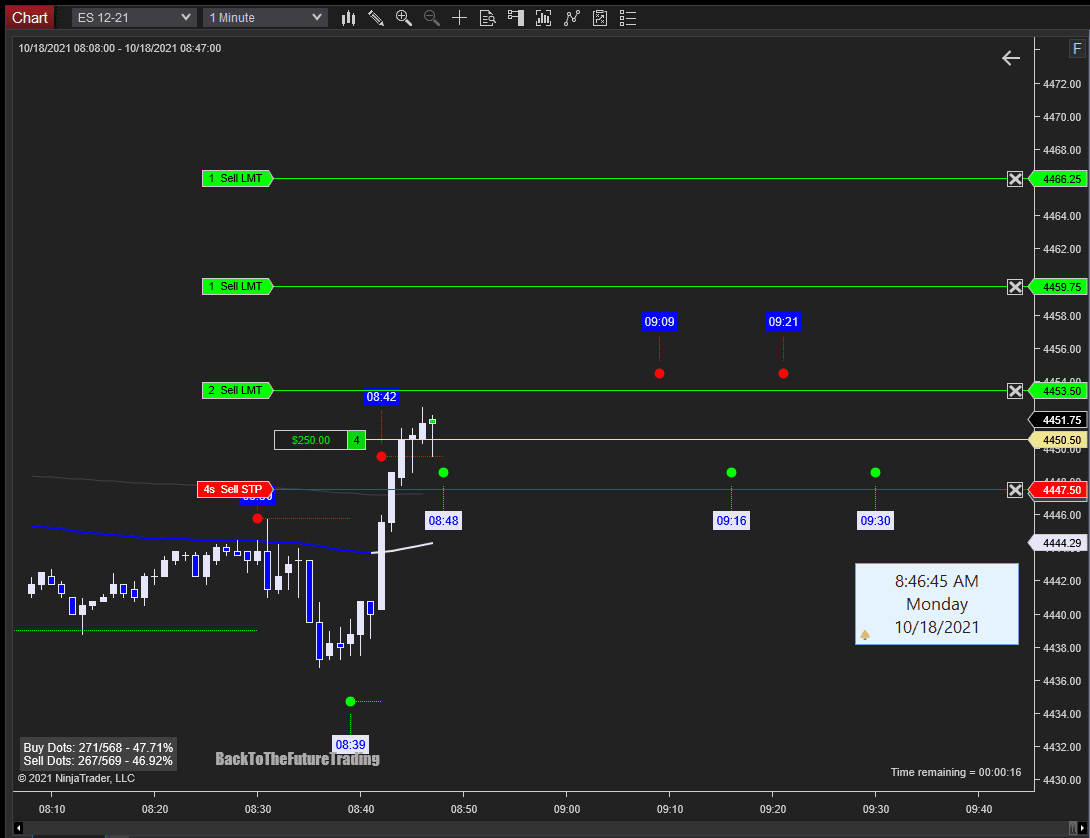
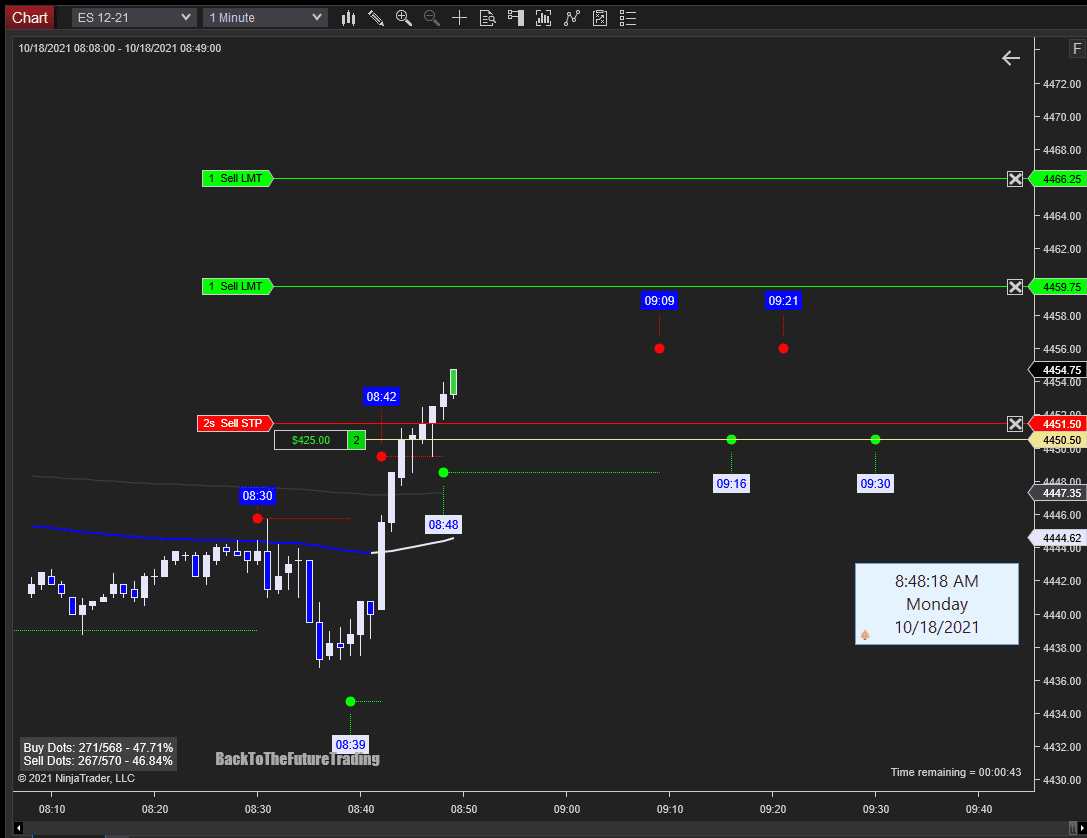
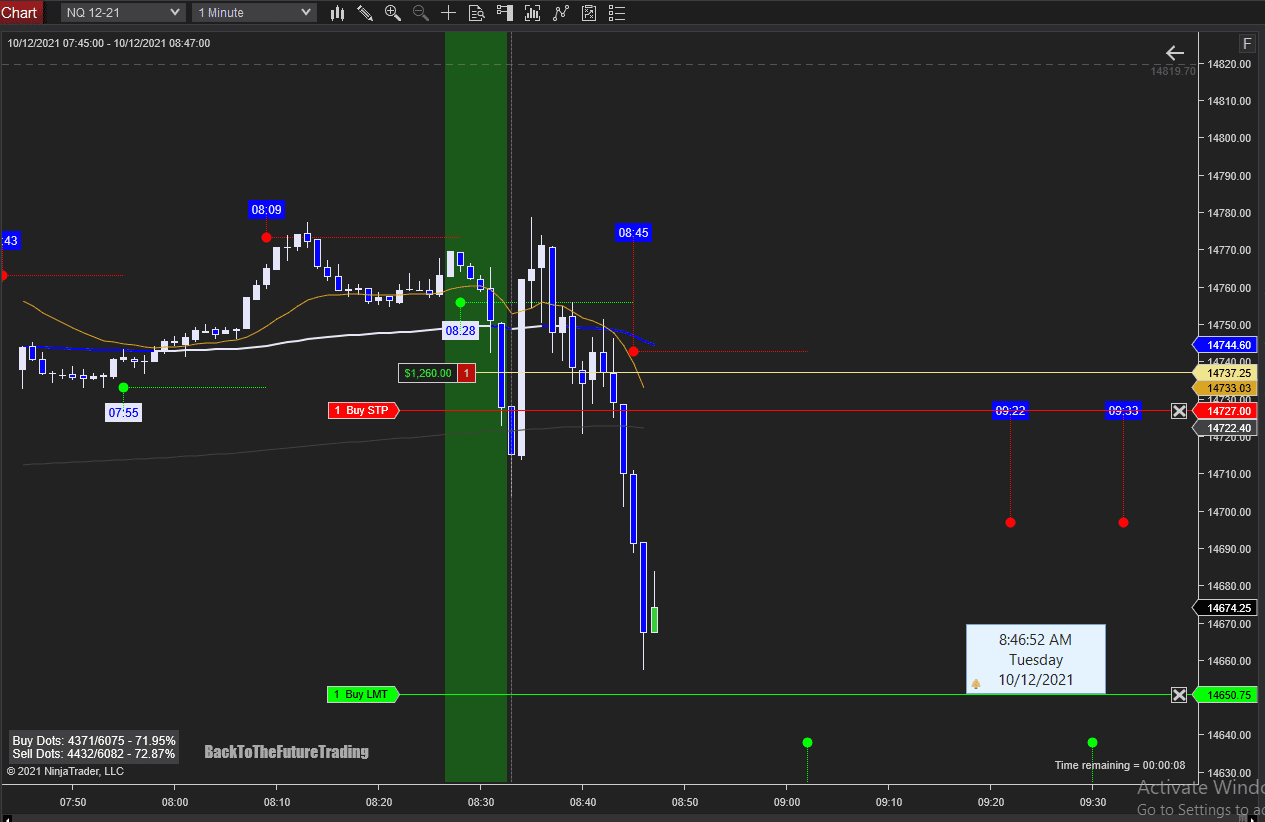
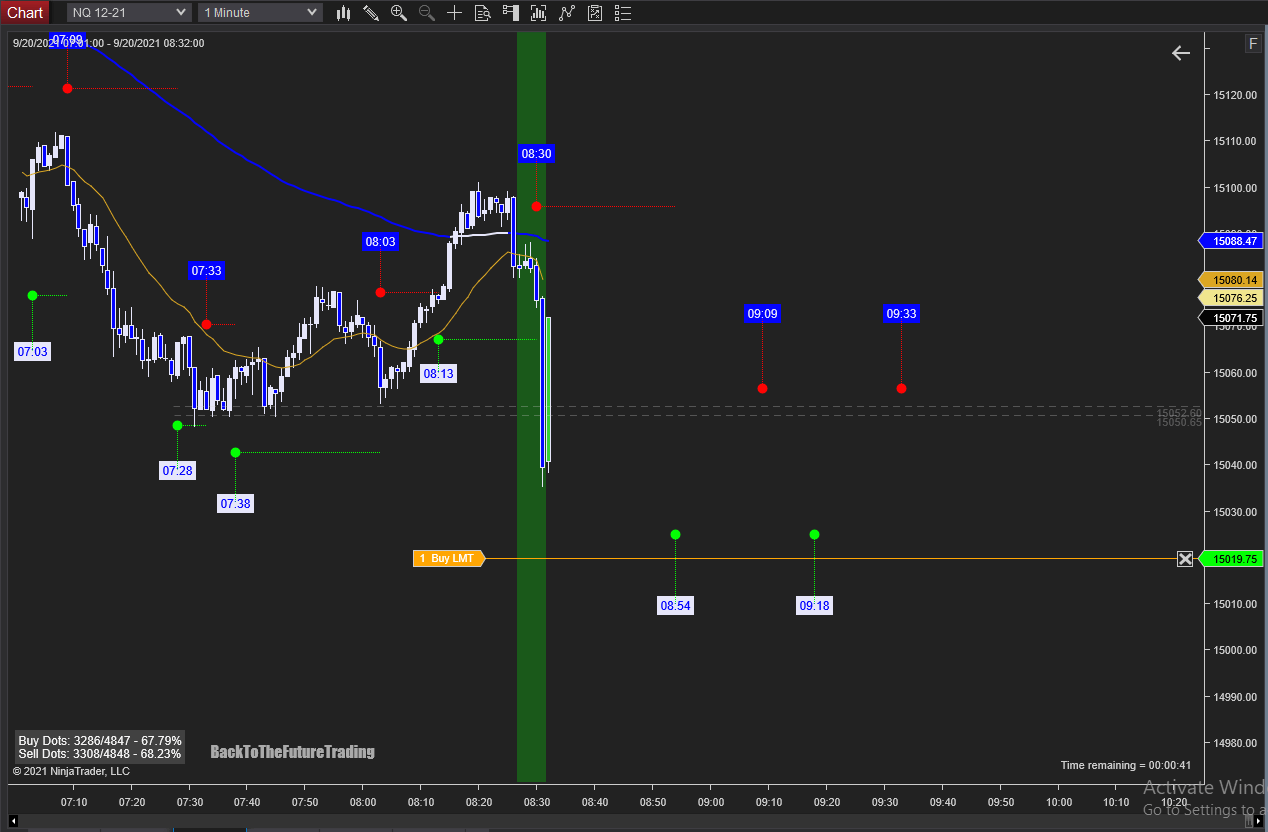
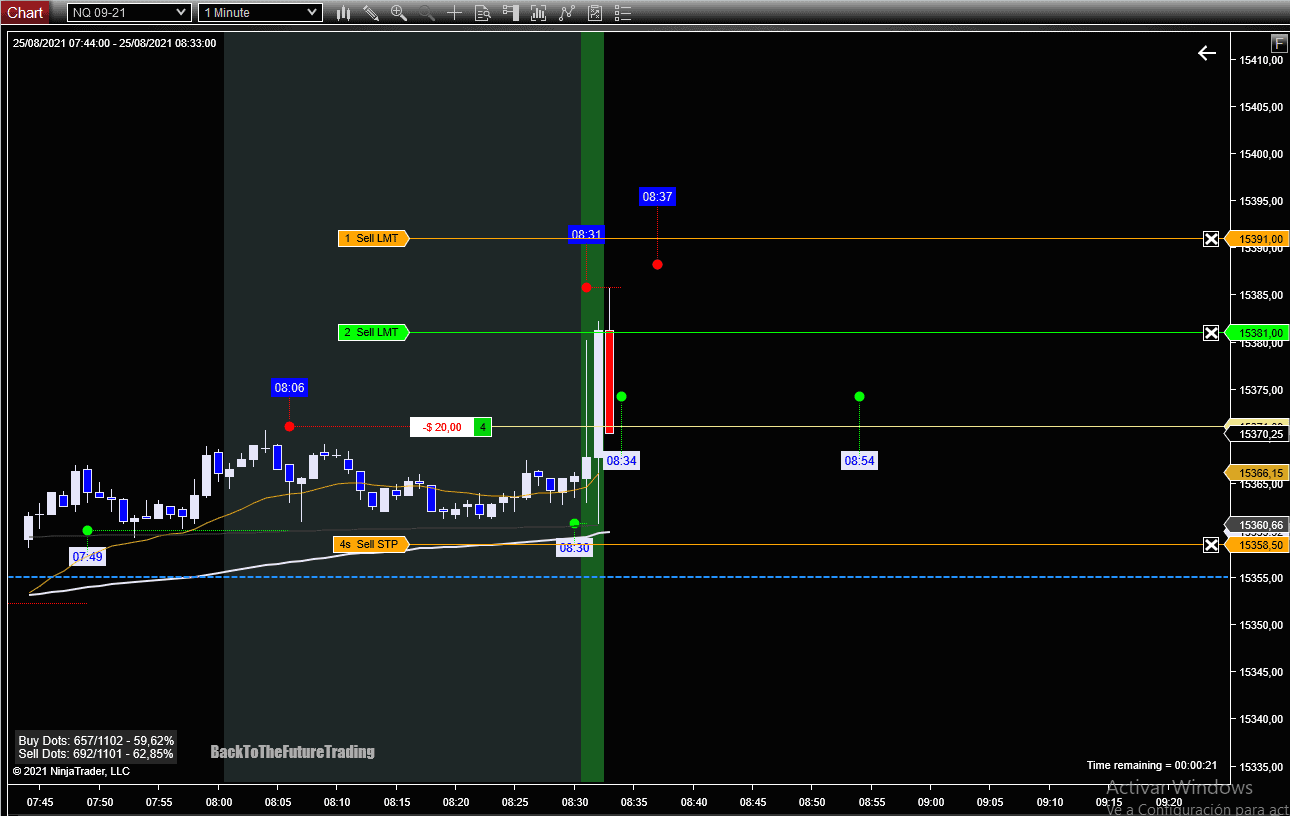
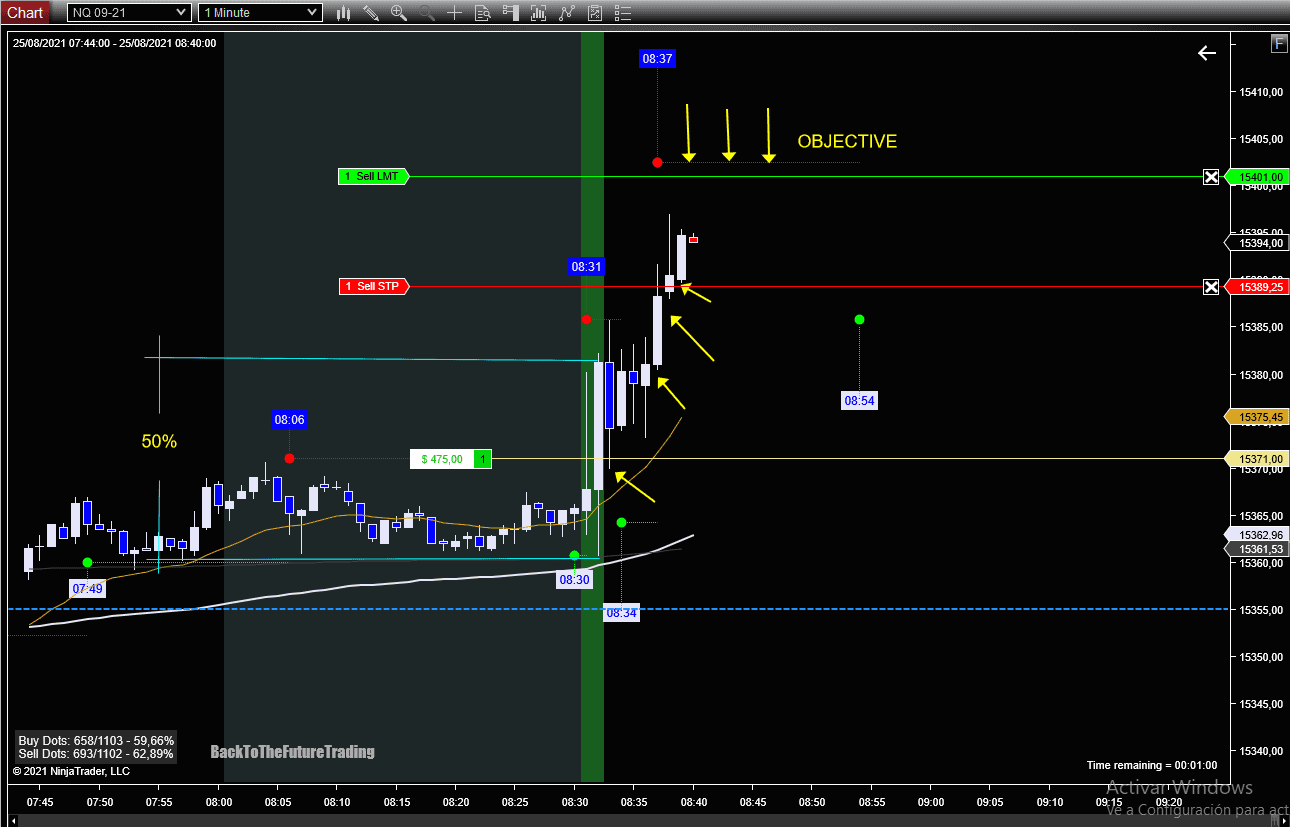
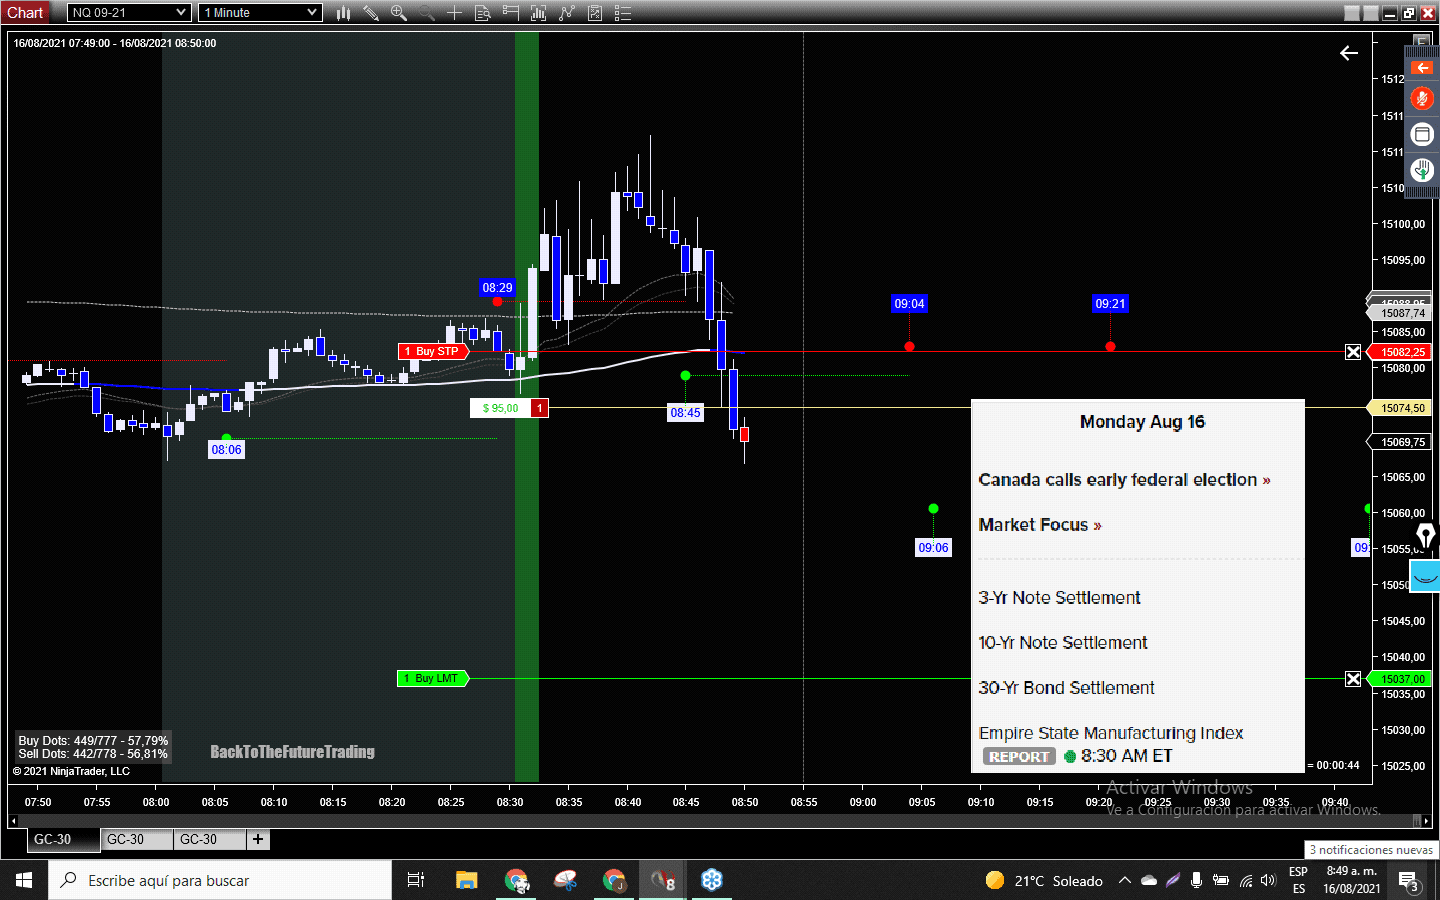
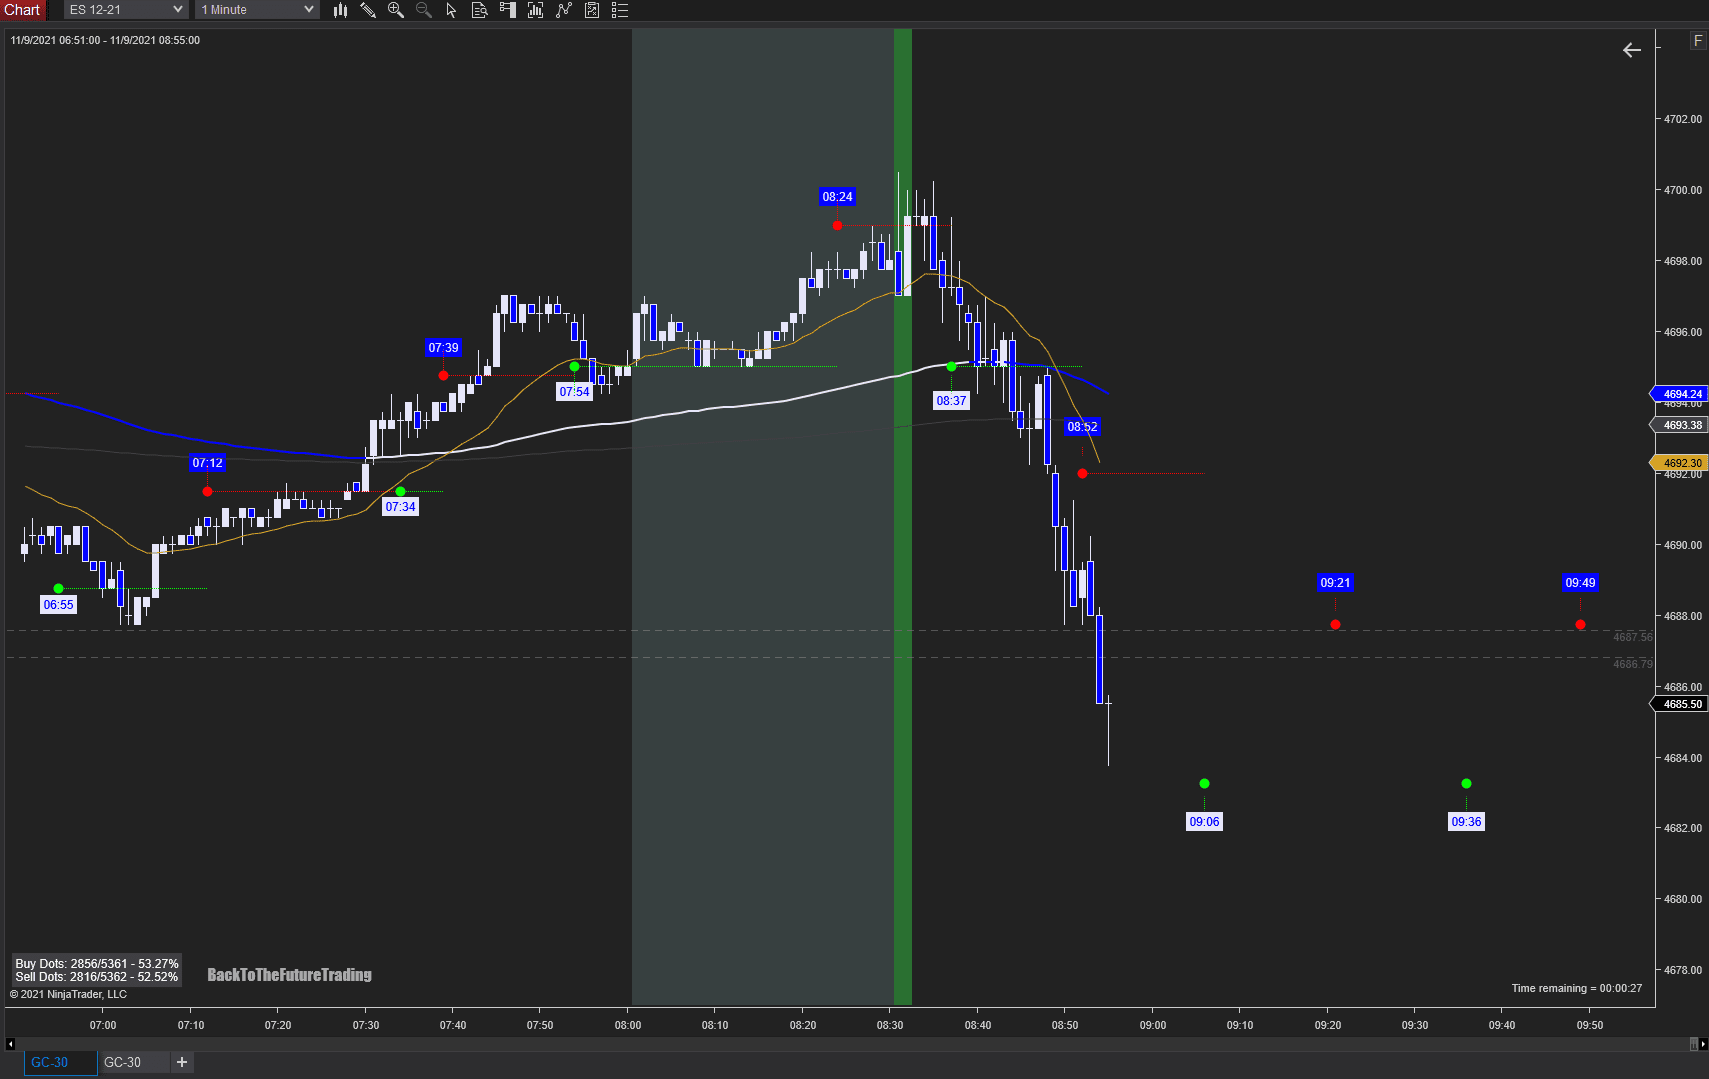
My objectives? cover fast the 1:1 and hold the position until 8:52 time stamp. I cover my first 3 contracts and move my SL (Stop loss) at point of break even.

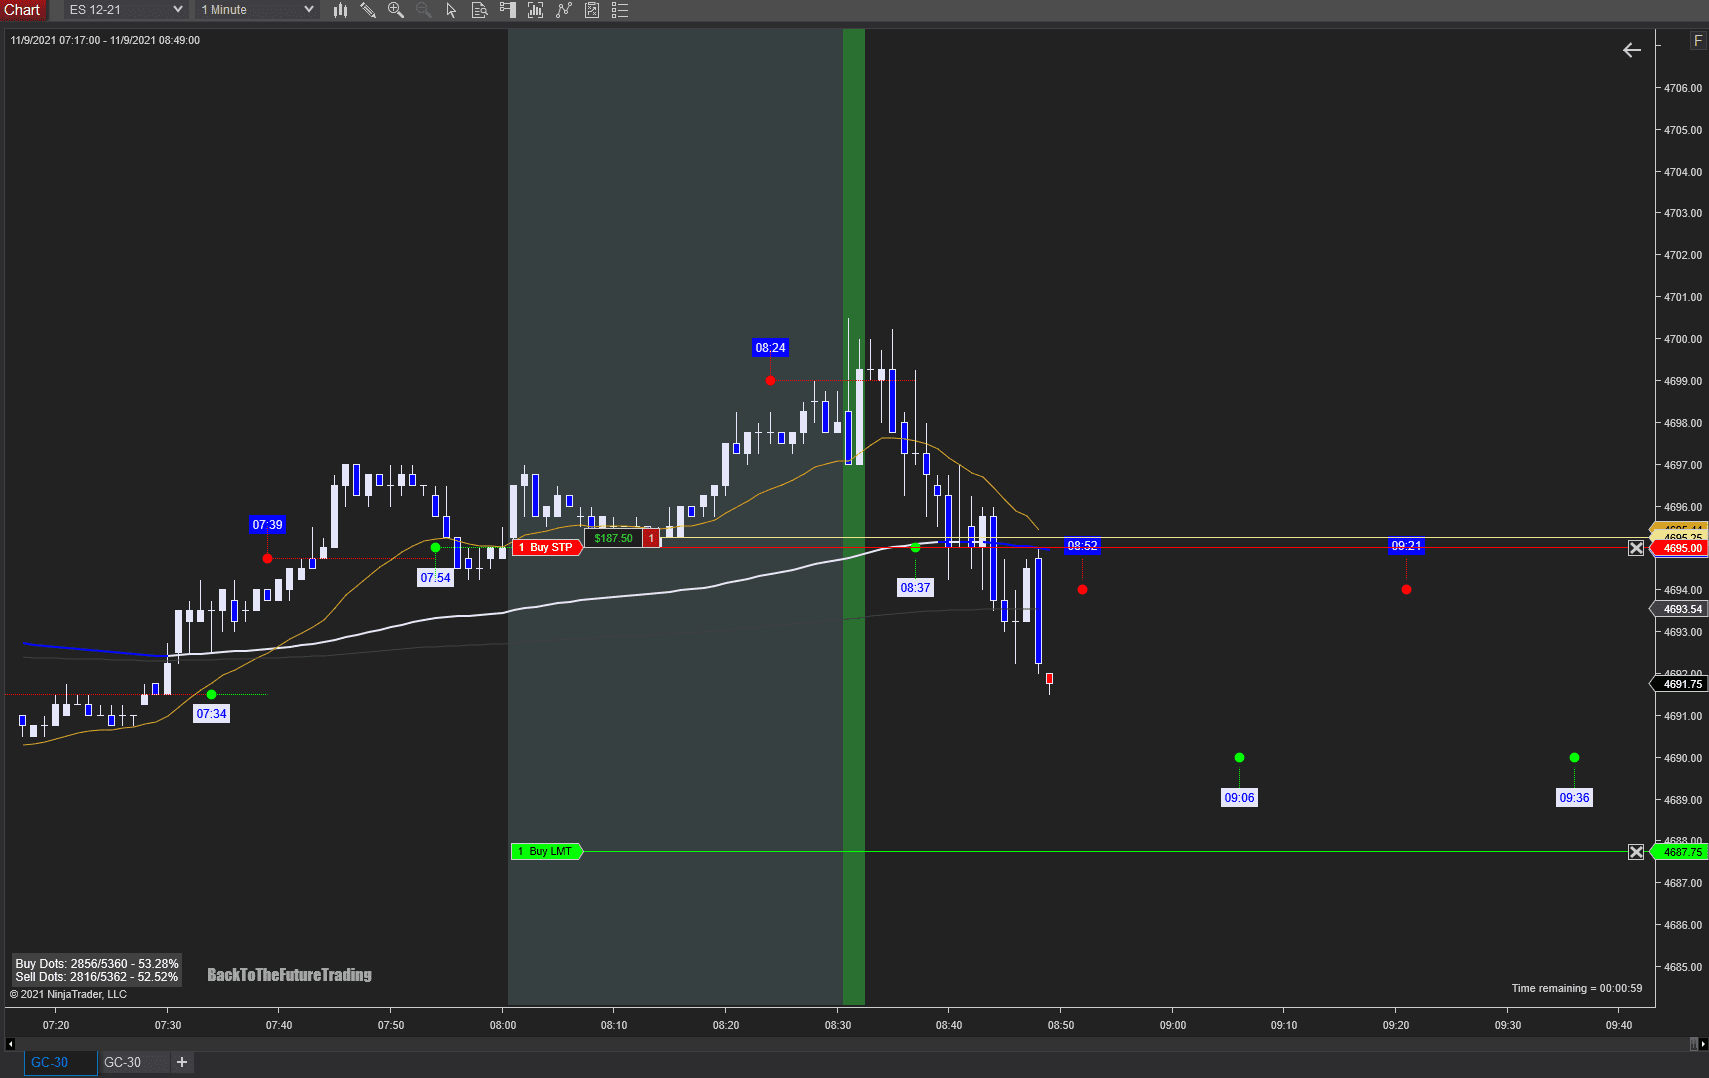
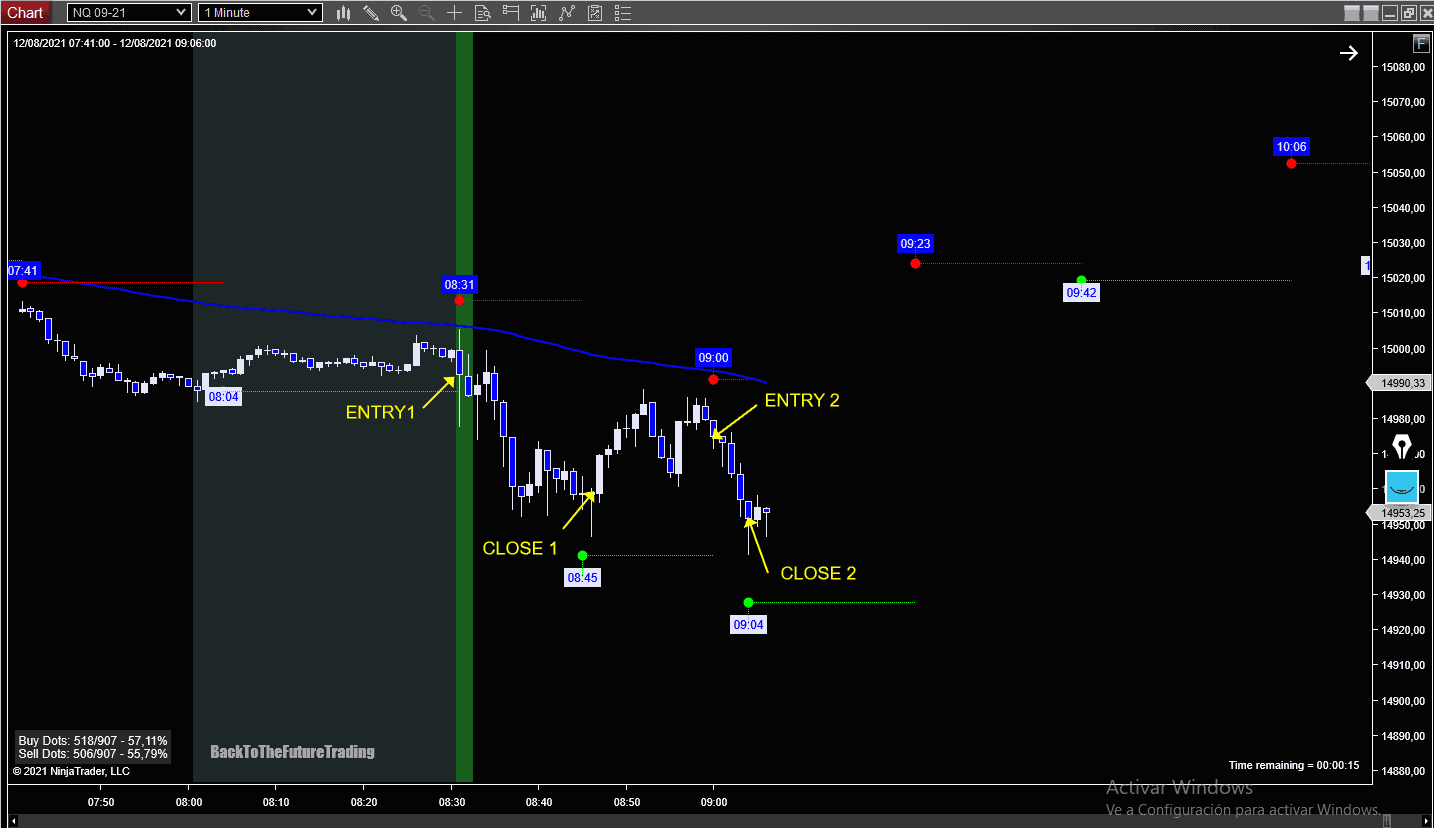
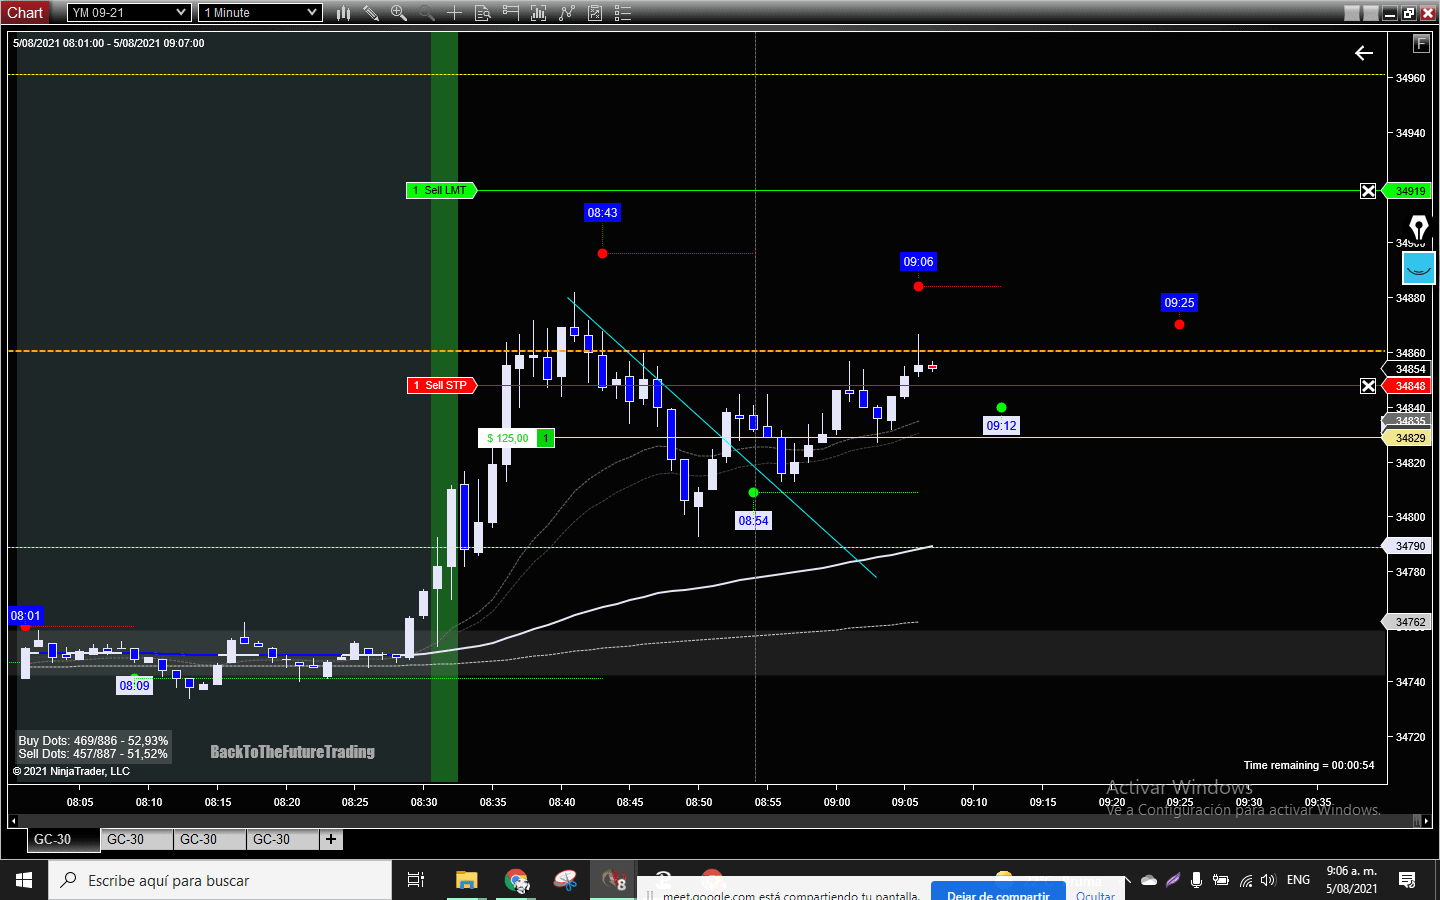
Now with profits you can:

  • Do not move the stop loss and wait until the next timestamp or
  • Manage your trade and trail the stop until the price stops you out.
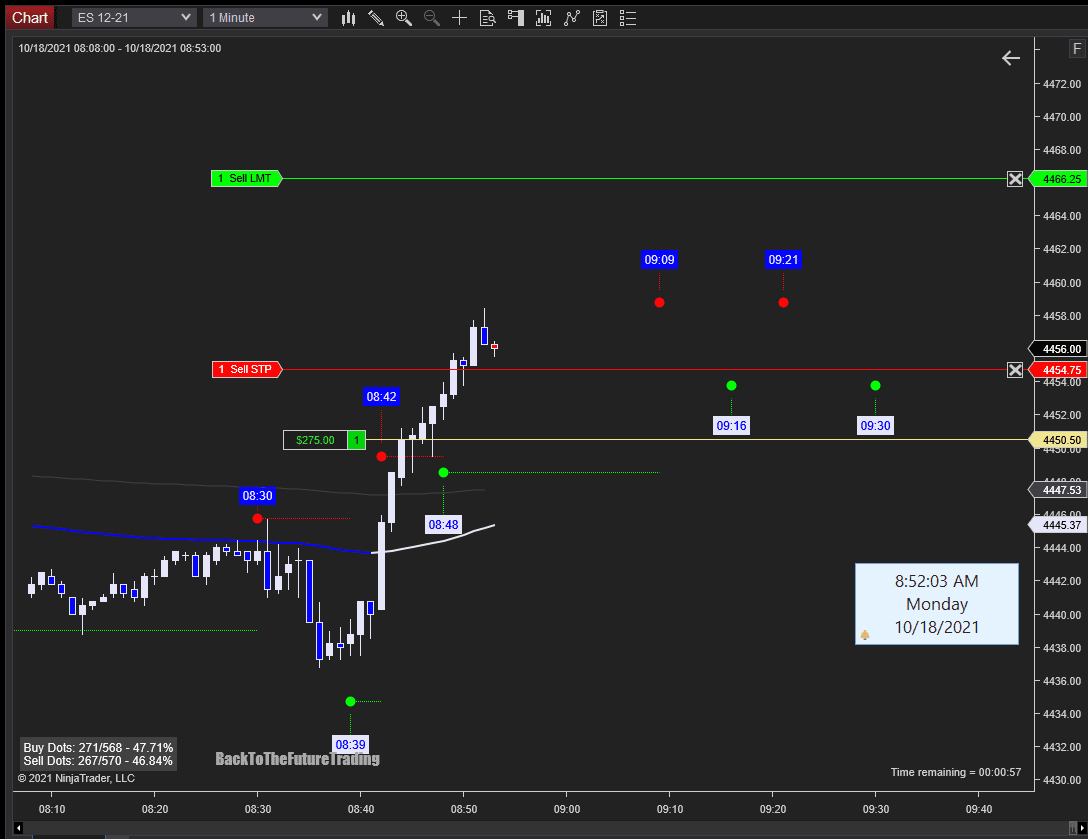
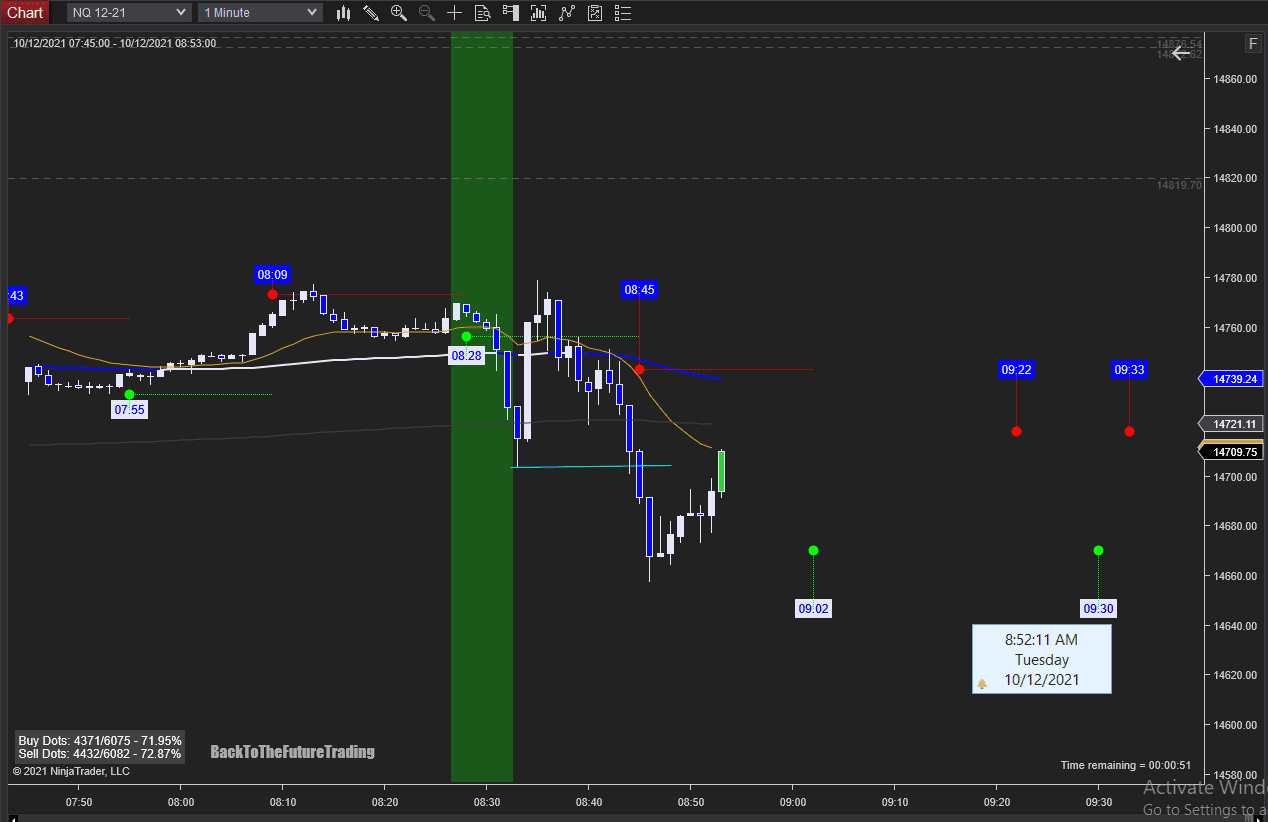
  • Wait the 8:52 candle that closes and close the trade.
  • Wait the 8:52 candle that closes and try go further to the 9:06 time stamp

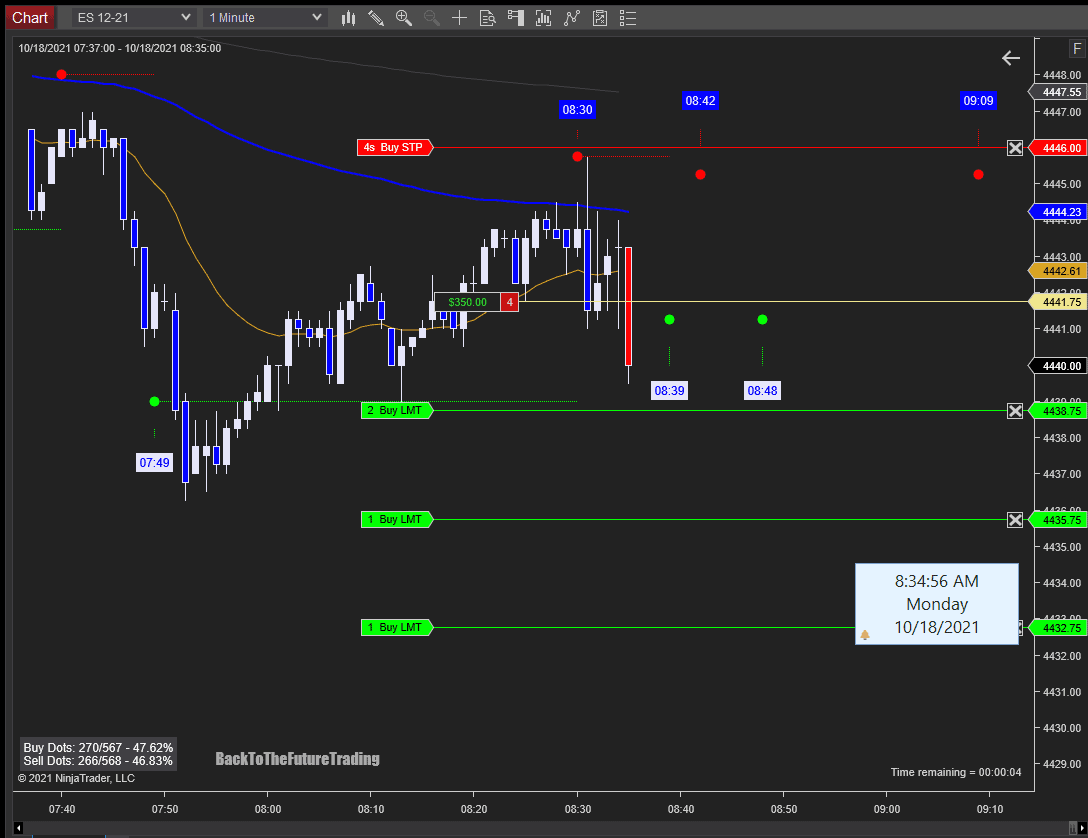
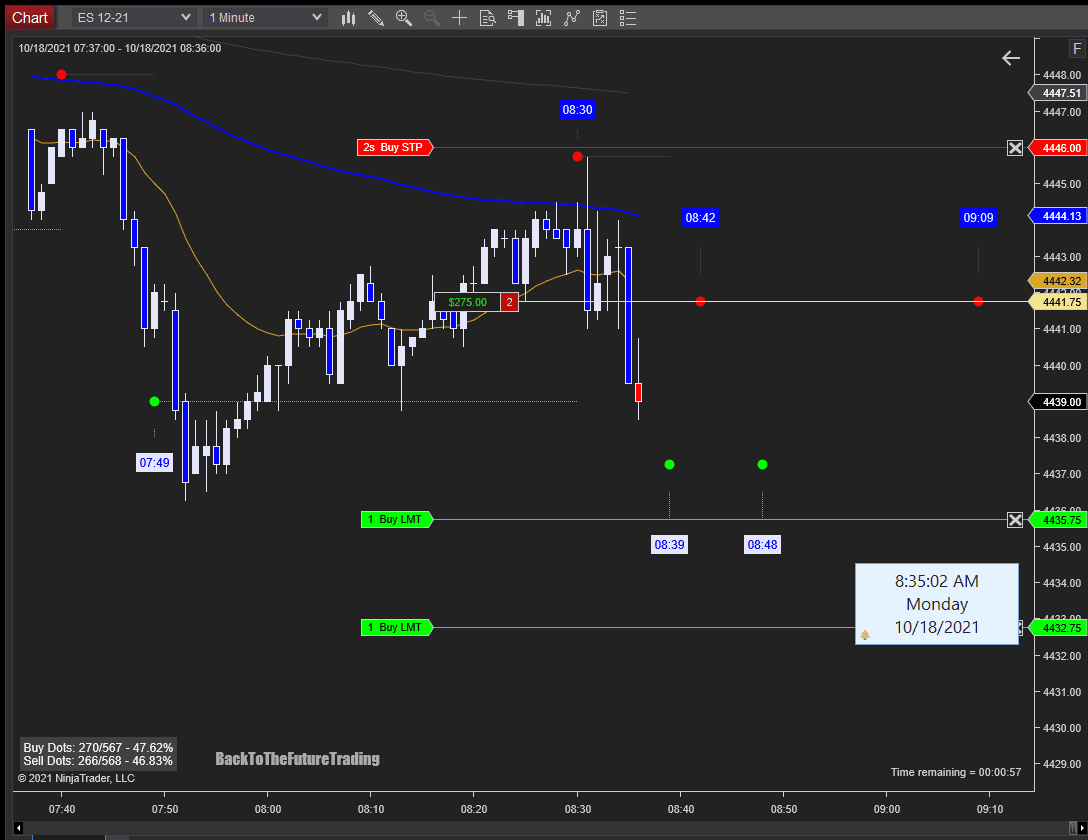
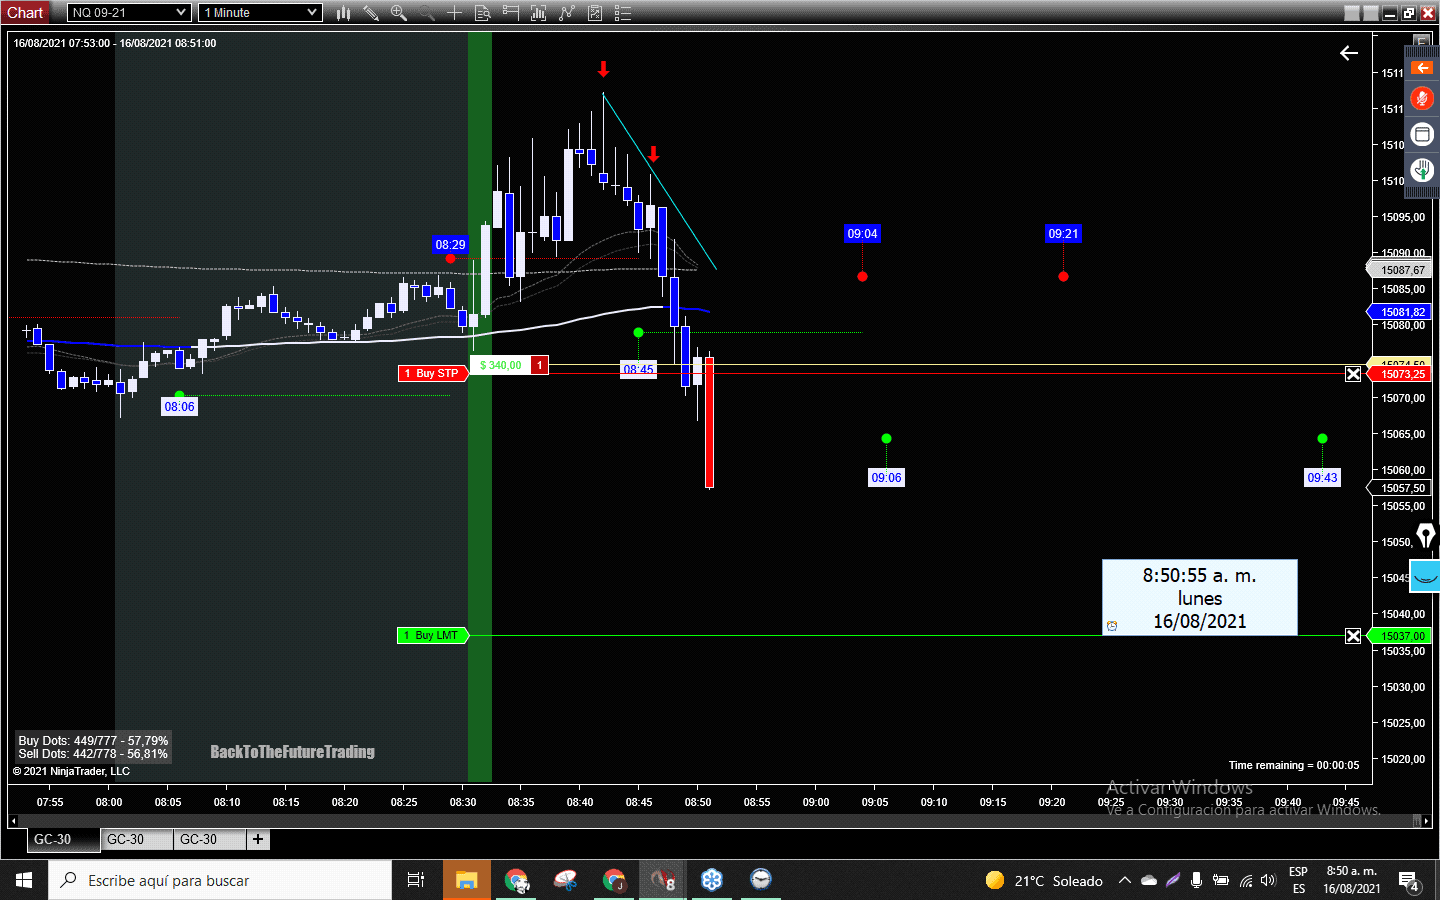
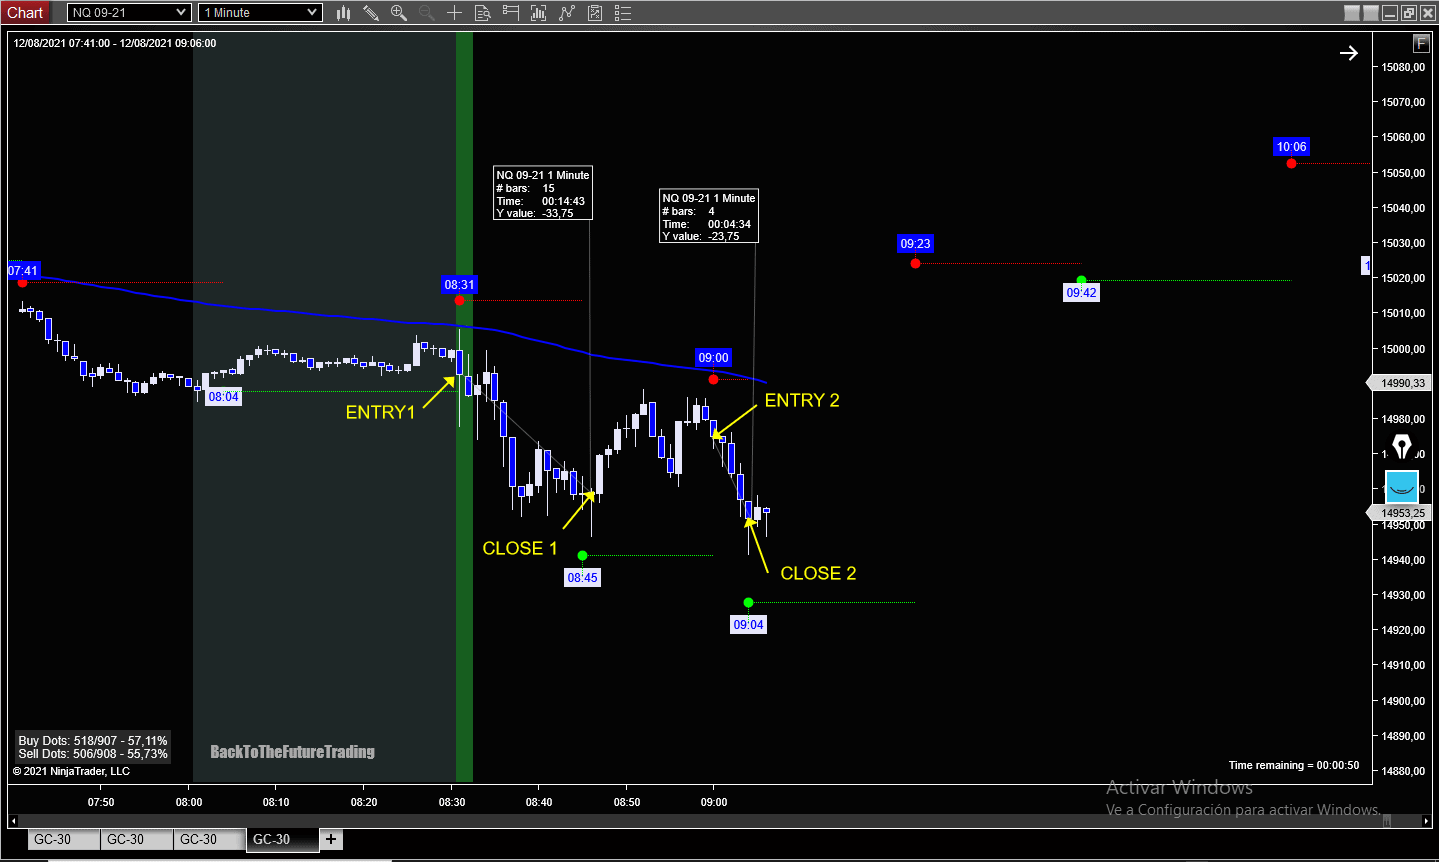
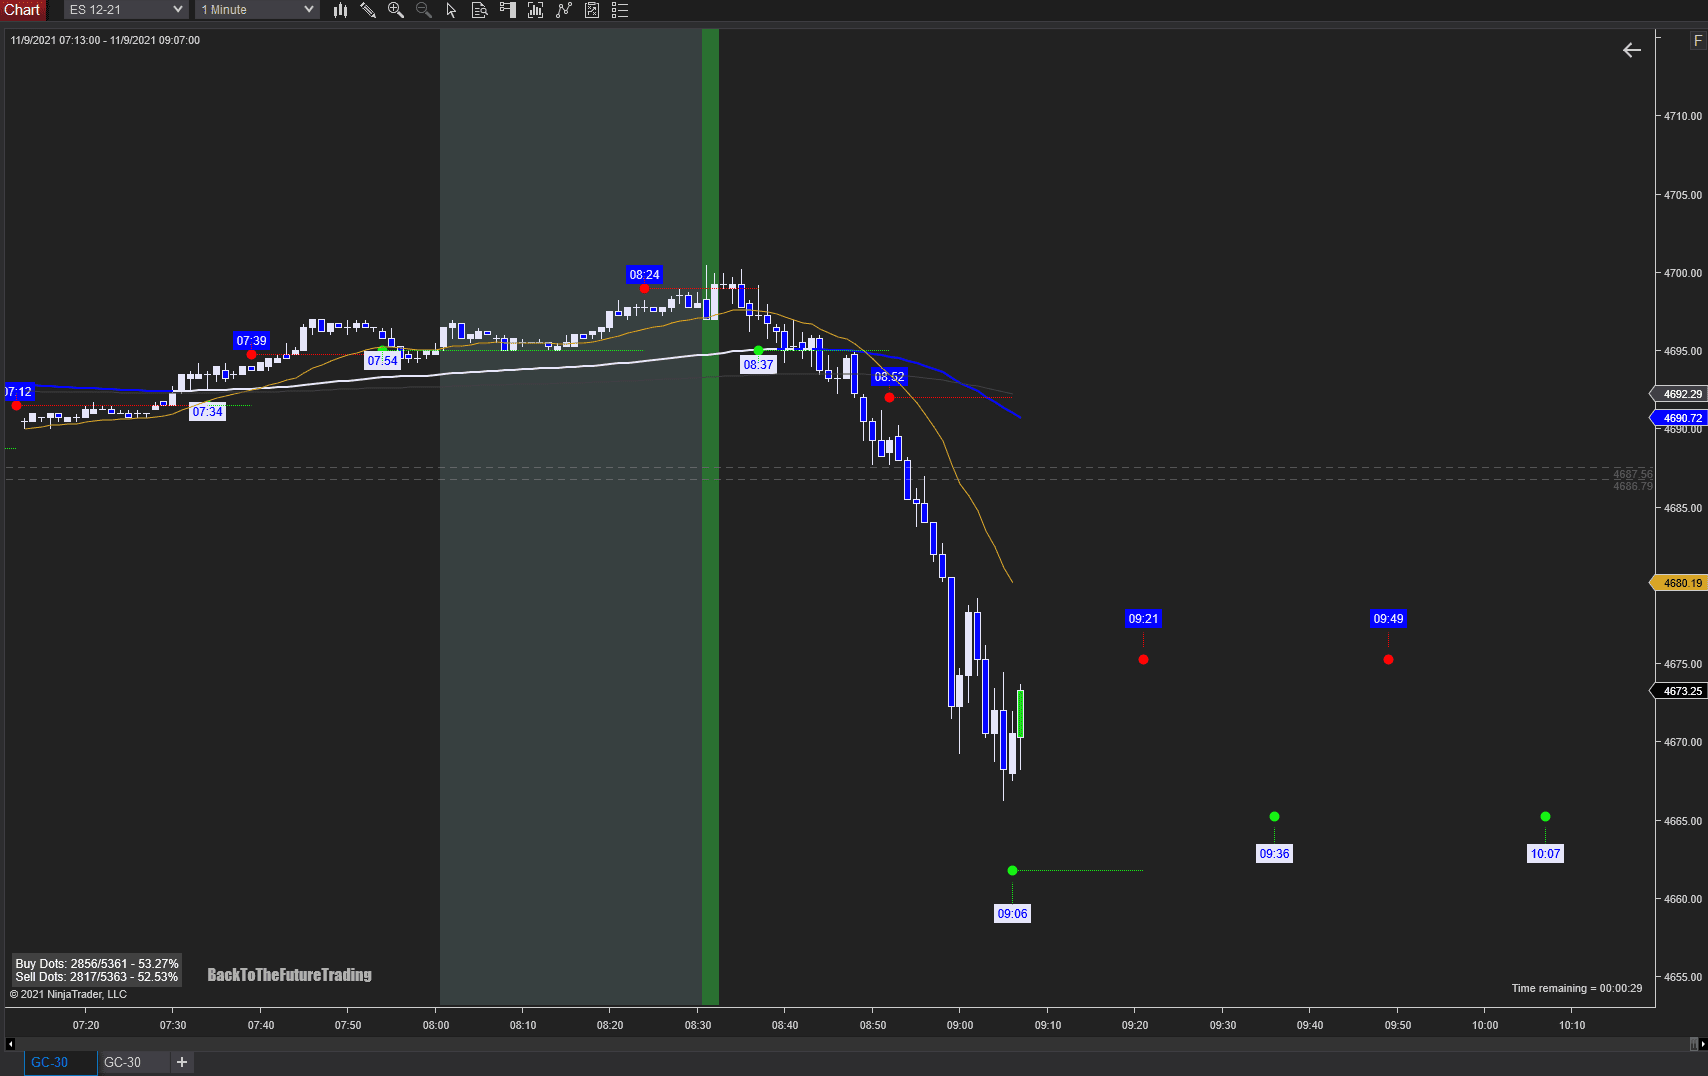
I do the fourth move and trail my stop loss level

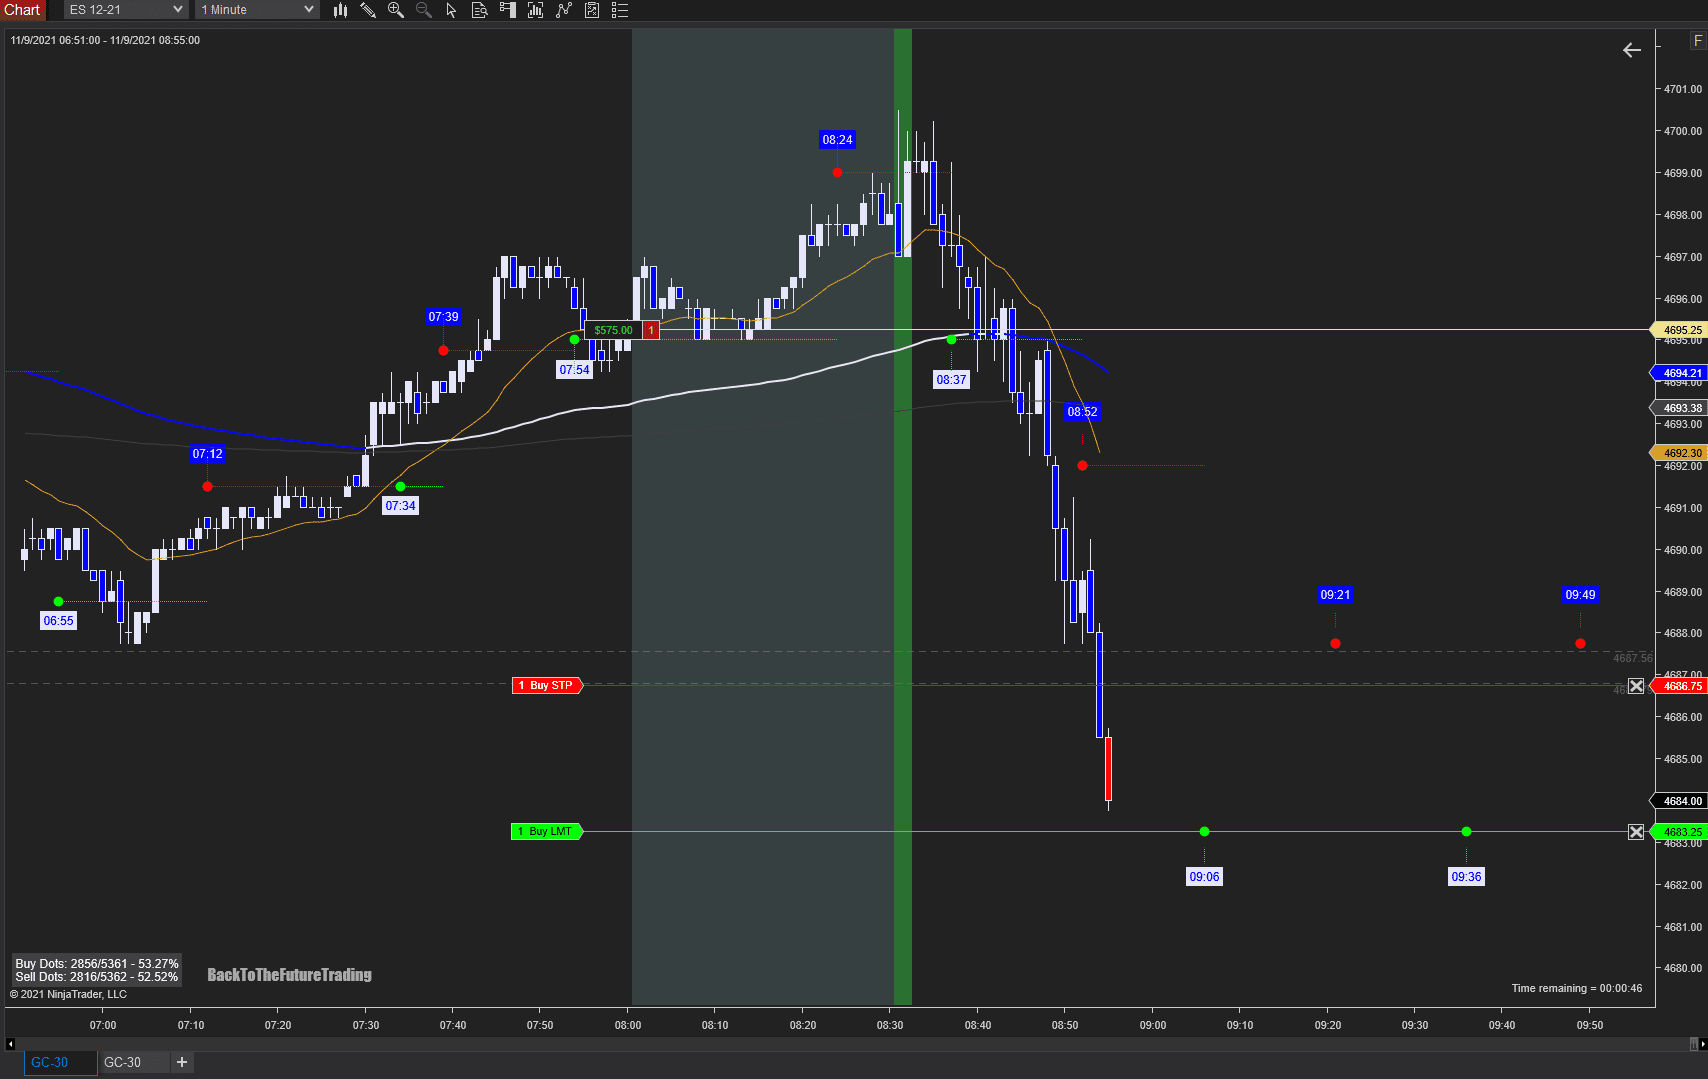
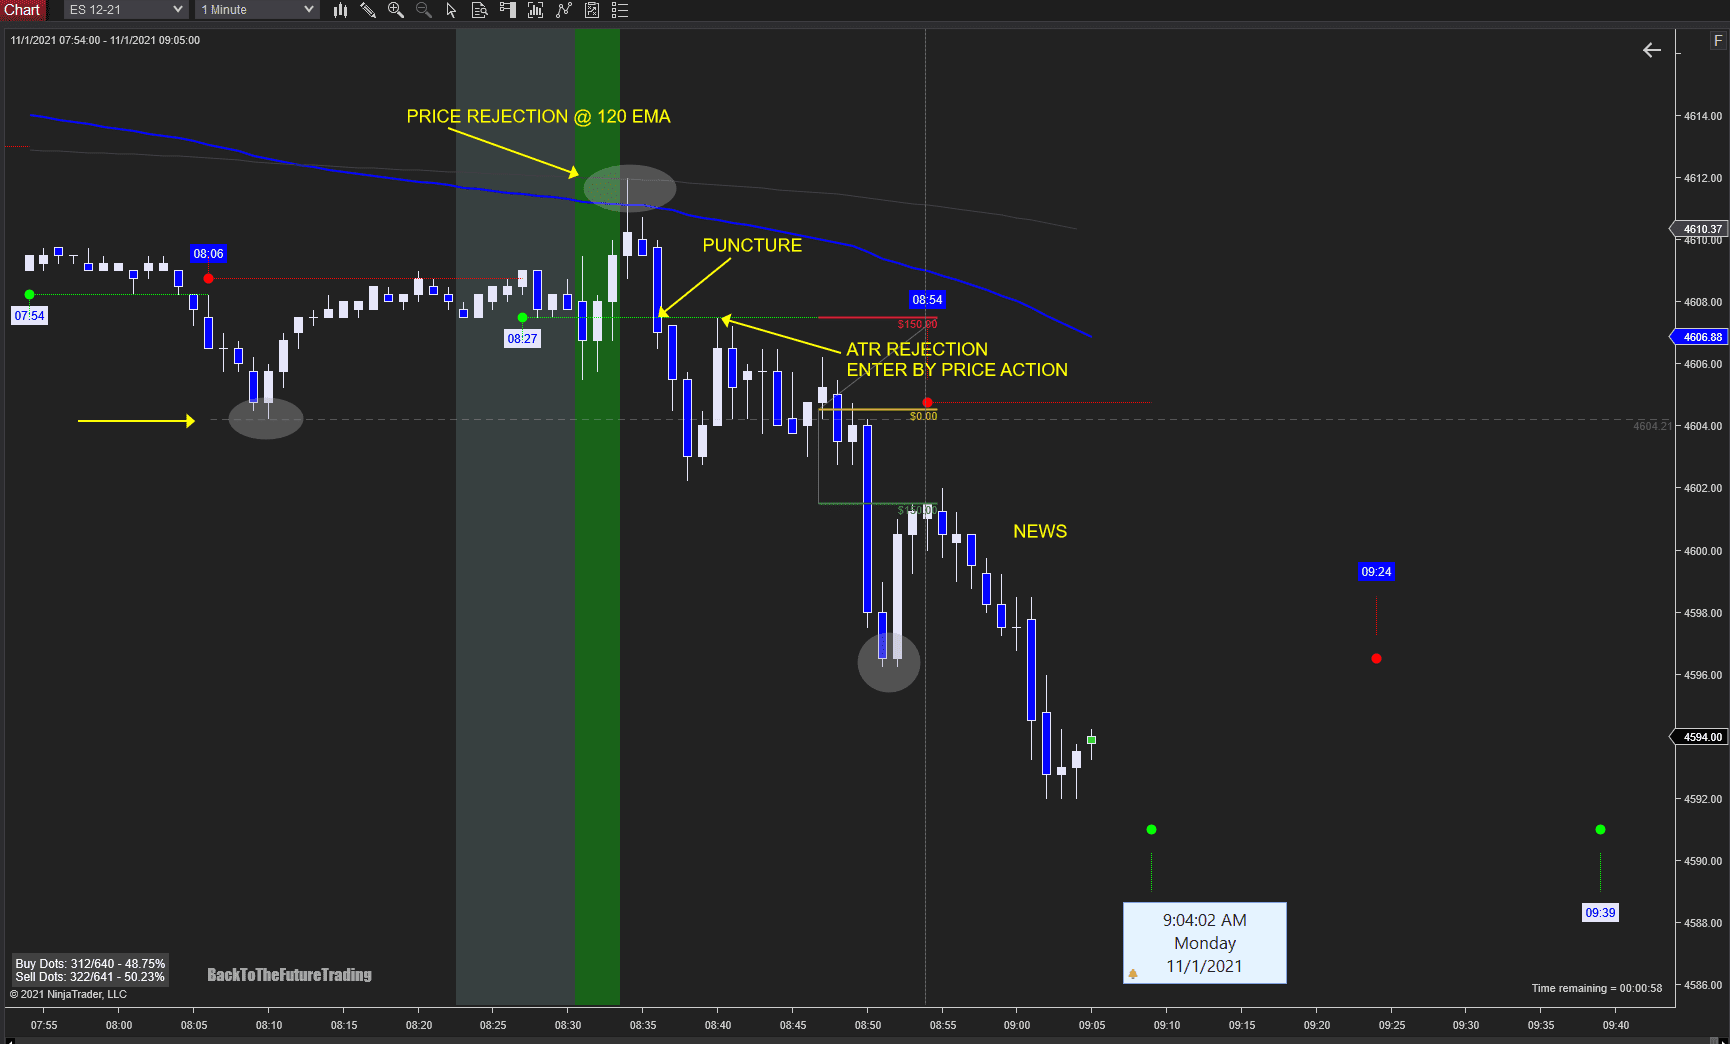
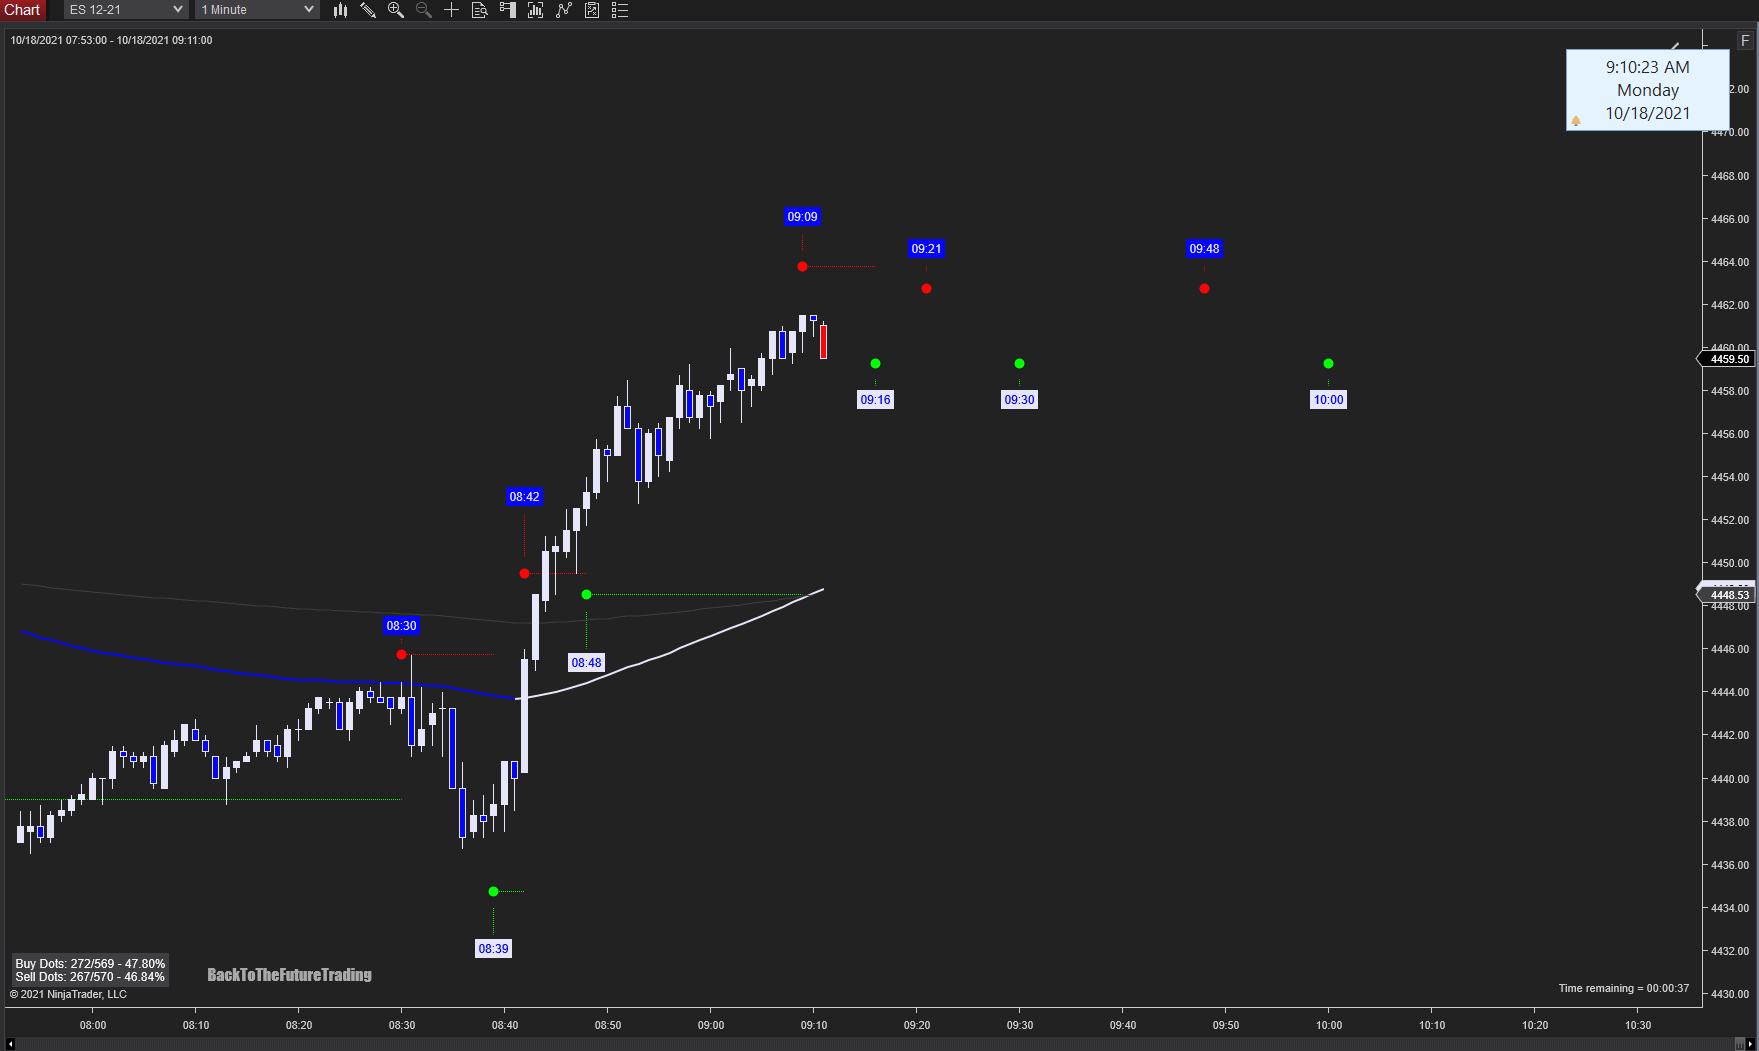
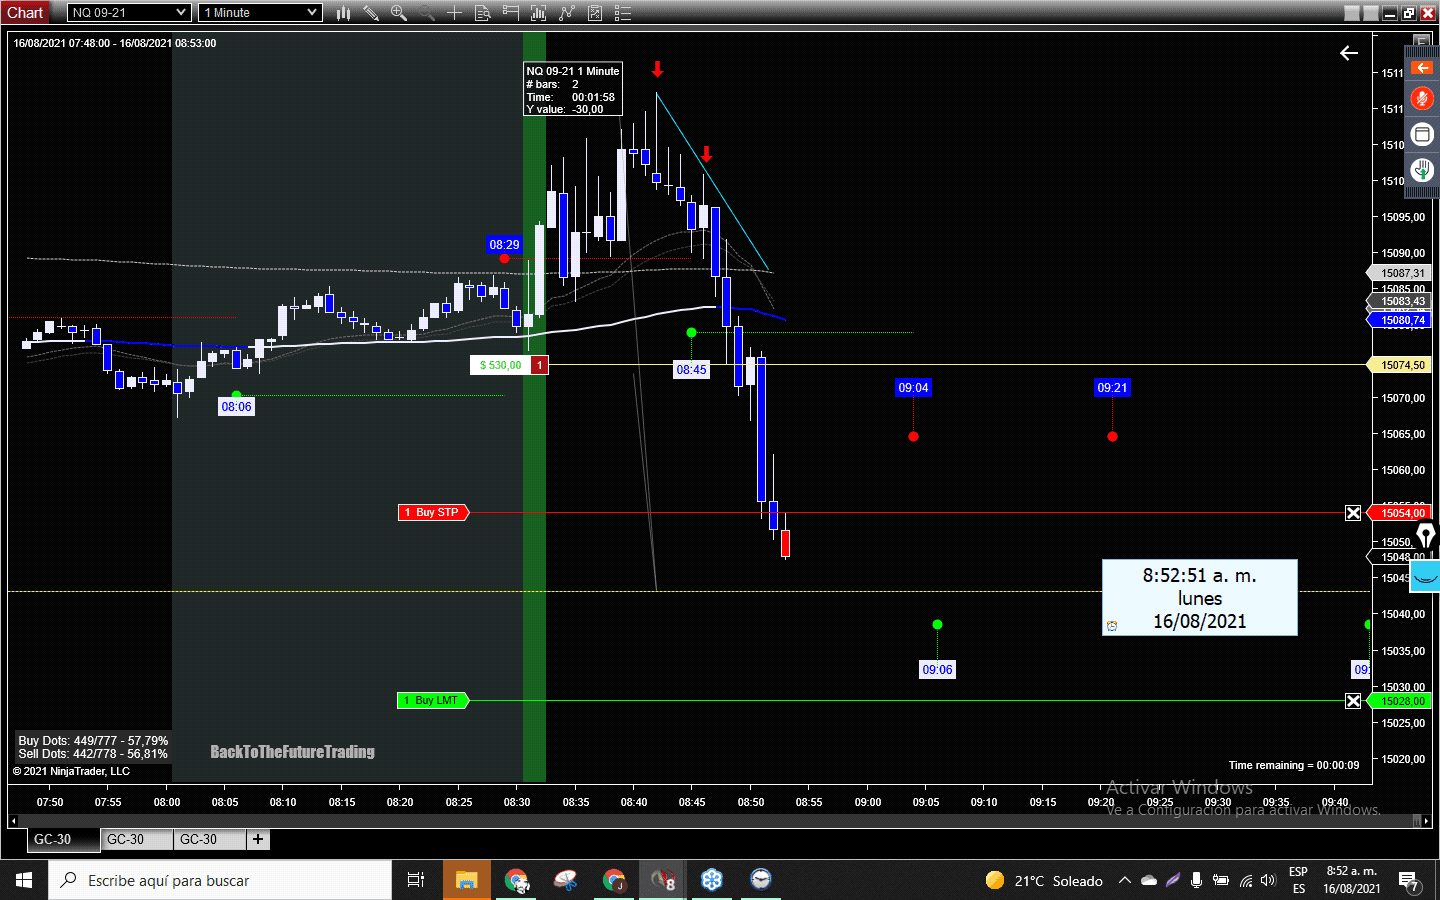
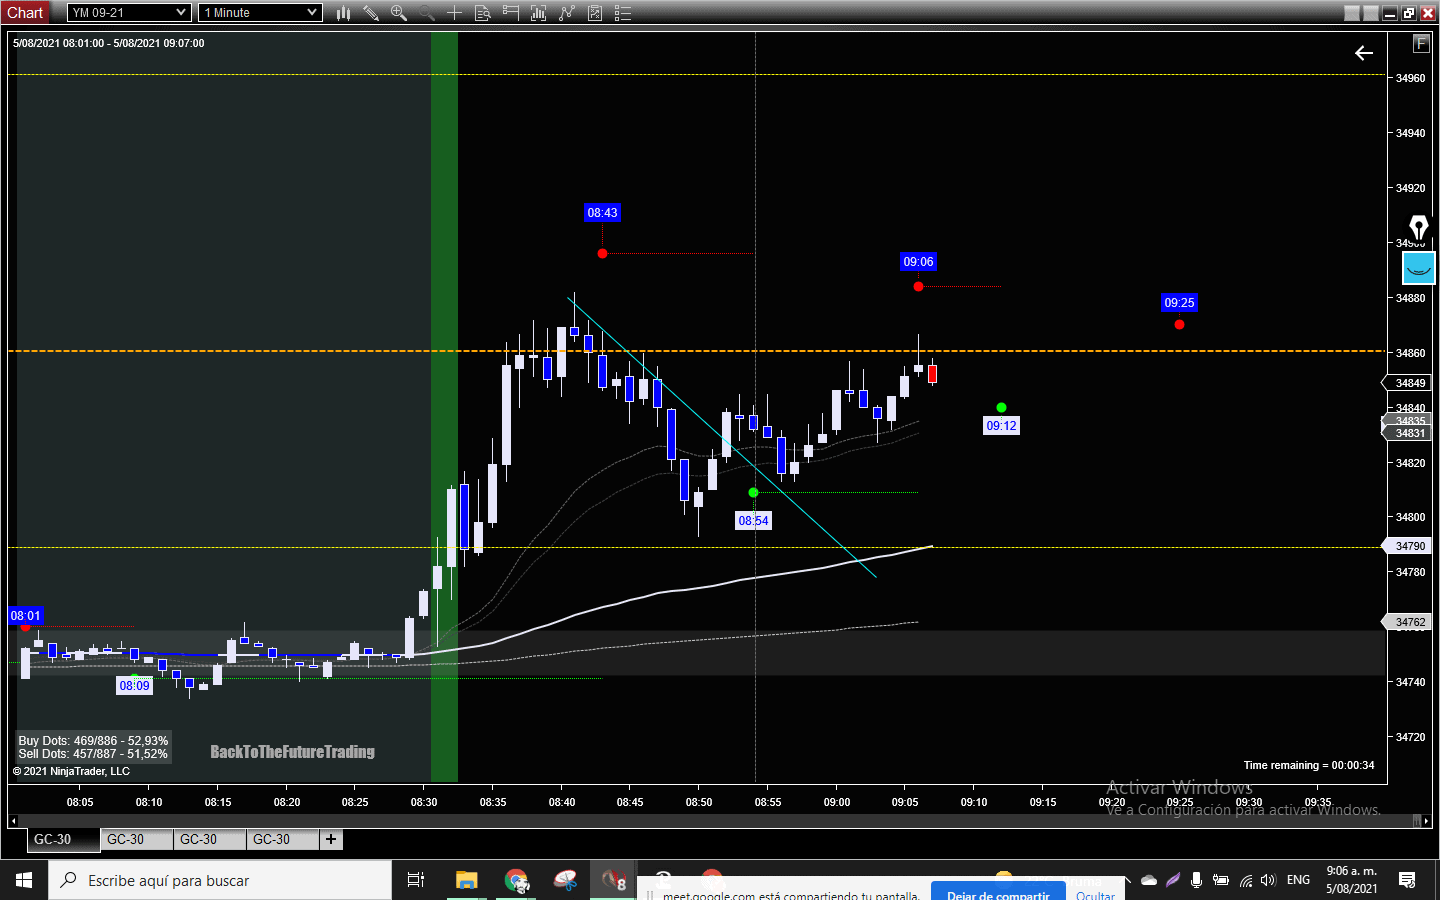
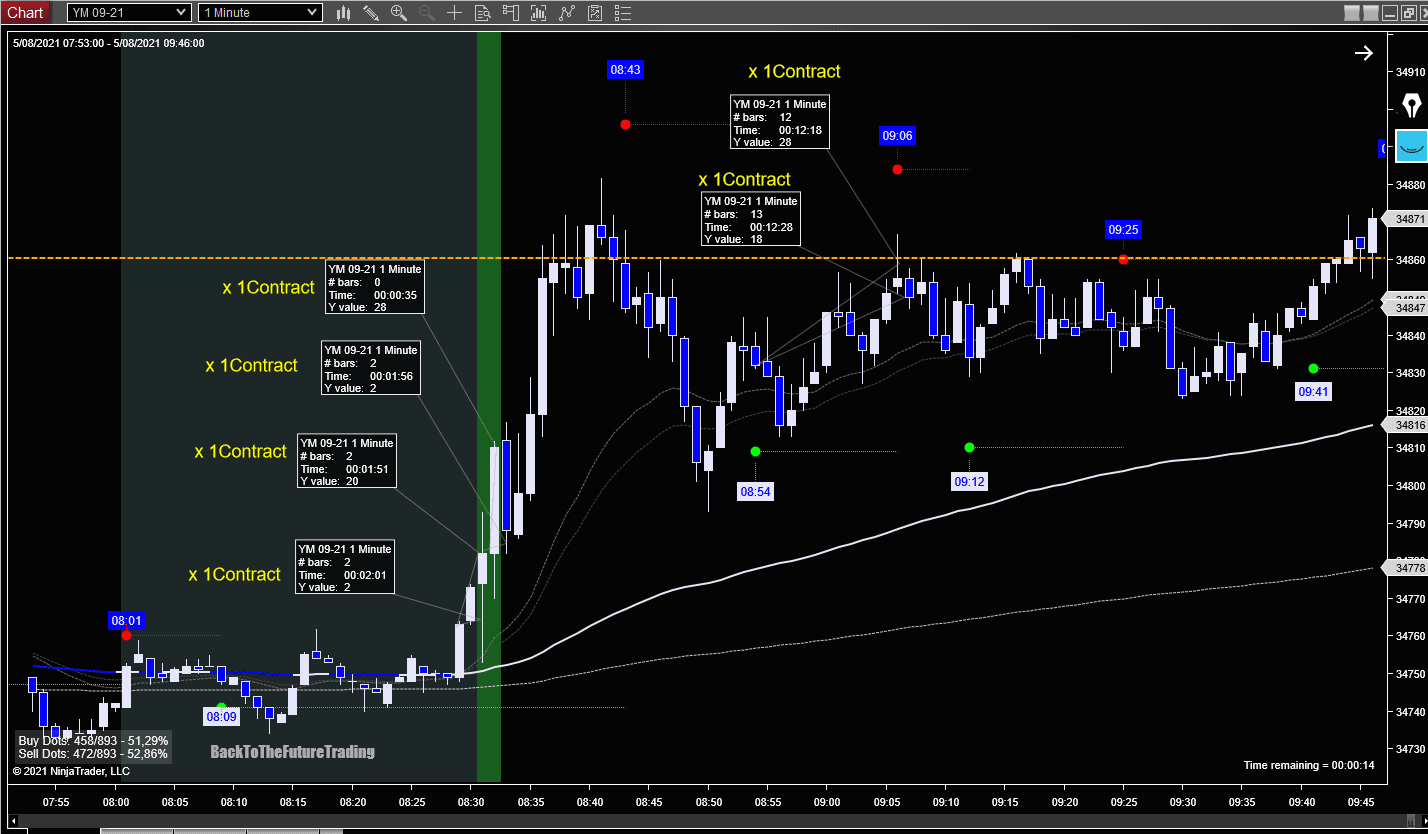
The price stops me out but makes a HUGE move!!

It also stops me out to early 😉 but was a great analysis and the movement closes lower at 9:06 time stamp

Juan Fernando Vega

Mechanical Engineer

Bogota-Colombia

Spanish – Support

Skype: juanvegam


ATR AND PRICE ACTION Emini-S&P 500

Trading Insights
featured image

Today's trade includes the puncture technique, a pullback to the ATR level and a pattern 2

Warp software include some rules to follow. Just read the last articles to understand them.

Look the 8:27 time stamp, it defines a horizontal line based on ATR calculations made by Warp predictive software. At the opening bell the price is rejected above, in the 120 EMA (Blue color). With that concept I open my first trade when the level of the time stamp is crossed down. My first target is the lower low at my left, my stop loss is above the candle that gave me the signal, and my final target will be at 8:54 time stamp.

The first target is reached, I move my stop loss at point of break even (BE). I identify the next lower low at my left again as a reversal level line.

The price reverses and stop me out. Remember the las article when I explain that I always like to put partial profits in my account

My next trade I use the ATR level again and Price action. At the minute 8:40, the price reaches the ATR level defined by the 8:27 time stamp again! So, I open the second trade. I reduce my position with 2 contracts. After reach the 1:1 level of positive move I move my stop loss to BE point.

The first target is reached

And after that I just follow the price manually until the price stop me out. I follow the price because the candles are so big, that the imminent reverse will appear.

For the next entry, just wait for the 8:54 timestamp to activate the third trade that is a Sell pattern 2, and repeat the process.

Interfaz de usuario gráfica  Descripción generada automáticamente

Juan Fernando Vega

Mechanical Engineer

Bogota-Colombia

Spanish – Support

Skype: juanvegam


Emini-S&P 500

Trading Insights
featured image

We are starting the week with one major ahead at 9:15.

Today a trade the EMini ES with the setup show in the next picture, using the WARP predictive software.

I take 2 trades. The first one at 8:30 with 4 contracts. Stop loss 1 tick above the red line of the timestamp at 8:30, first objective at the green line defined by the 7:49 am time stamp, to grab some profits, and for the other 2 contracts I want to hold them until the las lower low at 7:50 or until the 8:39 time expires that is the next time signal

The first 2 contracts were covered

Interfaz de usuario gráfica  Descripción generada automáticamente

And I move my Stop loss at point of break even

The next objective it’s the lower low at my left. I move closer the stop loss because the time window ends at 8:39, and the price could reverse.

My Stop loss close my last contract as expected.

The second entry is a puncture technique at the line plotted by the 8:42 am time stamp. 2 contracts covered for the 1:1 profit

Interfaz de usuario gráfica  Descripción generada automáticamente

At this point, I move my stop loss at point of BE. The 8:48 time stamp could reverse as a pattern 5, so I covered the third contact manually

Interfaz de usuario gráfica  Descripción generada automáticamente

For the last one I follow the price with each closed candle until it stops me out

You could also leave that last contract until 9:09 and would be a winner too, you decide.

Juan Fernando Vega

Mechanical Engineer

Bogota-Colombia

Spanish – Support

Skype: juanvegam


DOW JONES (Emini-YM)

Trading Insights
featured image

There are sometimes when the opening could be messy like today in the Emini Dow Jones.

Based on the indicator setup you have for your Warp predictive software you will have more or less number of printed dots.

I open trades in 1-minute charts always. Check the 8:28 timestamp in the chart below 2 minutes before the opening. As you read in my articles, I don’t like to open trades before the opening bell. Sometimes I do but based on the previous analysis I take the risk. This time stamp forms a pattern 5 when the candle closes at minute 28, I just wait, the price bounces on the 120 EMA of 3 minutes (Grey one) at minute 33. The price goes back to the last high (8:09 Time stamp), but never cross that high, So I think, when the price crosses the 120 EMA (Turns blue) I take the short. At minute 37 is the first try, you could open a trade there. When the market seems to be messy, I like to wait a second attempt, so, in the candle of the minute 36, I open the trade.

Now be aware of the timestamp at 8:45, if the price continues going lower, and time finishes, creating a lower low, a pattern 4 will be created. For that reason, I take partial profits (2 contracts).

For the last contract I move my stop loss at point of breakeven, and leave it, I want to see if I can reach the next timestamp (9:02)

As expected, the price reverses, and take me out.

Juan Fernando Vega

Mechanical Engineer

Bogota-Colombia

Spanish – Support

Skype: juanvegam


Are you ready for fast Movements?

Trading Insights
featured image

This article combines different techniques for Warp predictive software. These techniques are described in the last articles. You can read them and understand the terminology, and the concepts read here.

The promise of Warp predictive software is, when you see a signal just trade them following few rules. In other articles I explain that personally I don’t like to exactly the open I wait after 3 minutes and give it a try.

Today before the open in the Emini Nasdaq, there was a red dot bearish stamp signal at 8:30 , let’s say very tempting. I decide to trade it. Nasdaq is fast, and my advice for you is, that if you never have trade Nasdaq at 1 minute chart, do it in mayor timeframes like 3 or 5 minutes.

**Always wait until the candle closes**. Five (5) seconds before it closes, I hit the sell button:

Mentally i:

  • Know that a pattern 4 will be formed (reverses), the price is creating lower lows at the 8:30 stamp.
  • Check at my left the last Lower low
  • Draw a line to help me to see it
  • That low is my first take profit zone (I want to cover my first contract there (some cash in!!). When I cover the contract, I move mi SL at BE point.
  • Where? I used the green line plotted by the 8:13 am stamp
  • I ask to myself? where do I cover my second contract?
    • Option 1: at 8:54
    • Option 2: Split the distance between 8:30 and 8:54 in three parts and cover the contract in the first third.
    • Option3: If I cover the first contract and my SL is in place, I leave it: or Stop me out or I reach option1.

That’s my mental process but all this analysis happens in less than 2 minutes after I open the trade.

In this chart, ATM automatically move 1 SL to BE. My hand is in the second contract ready to move it to BE if first contract is covered.

First contract covered in the last low., I’m in the minute 31…

The price reverse so fast and stop me out. The option 3 of my initial analysis was fulfilled.

This chart will help you to understand the steps

Nearly $600 usd in minute trade, really fasttt!!!!

Juan Fernando Vega

Mechanical Engineer

Bogota-Colombia

Spanish – Support

Skype: juanvegam


Pattern 1, Crossover and puncture Techniques for Warp Predictive Software

Trading Insights
featured image

When you see me trading Emini Nasdaq using Warp predictive software I use the green dots over the 120 EMA as buy signals; It’s called Pattern #1.

The red dots under the 120 EMA are used as sell signals and is called Pattern #2. When you buy the software, you have all these configurations in a Handbook in PDF format.

For today with the setup that I have for my predictive signals, shows me my first buy opportunity at 8:37. At this point you open the first trade (ENTRY 1), this is a Buy P1 pattern, and with 2 contracts or more you can:

  • Take profit at the las high first, move your SL at point of break even and,
  • Close the second contract or rest of the contracts at 8:51 when the time for that candle in the 1-minute chart ends.
  • Or you can close all contacts at 8:51

For the entry number 2 (ENTRY 2 in the chart) I used the crossover EMA 120 technique. You wait until the candle closes under the 120 EMA, open the trade, the stop loss is above 1 tick over the candle, and you take profits at the next timestamp when the time of that candle expires.

For the entry number 3 (ENTRY 3 in the chart) I used the puncture technique. It consists in wait a candle that crosses and close under the green level defined by the 9:03 signal and open a trade short. The stop loss is above the candle 1 tick and you can grab 5 to 8 ticks of that move easily.

There you have it, Pattern 1, Crossover and puncture Technique for Warp predictive Software and the correct way to manage risk and take profits.

Juan Fernando Vega

Mechanical Engineer

Bogota-Colombia

Spanish – Support

Skype: juanvegam


ARE YOU AFRAID OF BIG CANDLES?

Trading Insights
featured image

When I’m ready to open a trade using predictive WARP software, I use a predefined simple plan. There are 4 techniques defined to use when you trade with our software.

  • Buy or Sell above or below the 120 EMA, when you have a white or a blue dot
  • Buy or Sell when a candle closes over the 120 EMA
  • Buy or sell on a stablished defined point using the candle closed over the line the dot prints.

I have already explained them few past articles before. But under my armor, I have other advanced tips that I want to share.

Today I trade Nasdaq, and we have DGO (Durable Good Orders) and EIA Petroleum Status Report news for today. At my charts I have a vertical green line, that remembers me, to trade after the opening bell when the minute 33 is ended. With that in mind, the rule of this trading system tells me to open a trade at 8:34. But the candle at the minute 32 is so big that ending that minute, as fast as I can I put a Buy Limit order at 50% of the movement, expecting to enter in a lower price.

The price makes the pullback and activate my trade. So, for BIG CANDLES use the 50% pullback technique. If you don’t want to do that type of moves, you just wait until the 8:34 signal to open the trade, you can choose.

I have an ATM defined for the Nasdaq so my stop loss, and profit targets for 4 contracts are defined. The price continues with previous momentum and closes 2 positions and I move fast my stop loss at break-even point.

When that happens, I just apply some risk management concepts. From now until 8:37 I am going to trail my stop, candle by candle but, I want to see a second week candle to do that.

The prices go higher and covers my third contract, and I keep moving my trailing stop

When the 8:37 timestamp signal ends, I can close the trade or wait and see if “they” want to push higher the price until the red line that the timestamp signal drew in the chart. My last contract is the “runner” I’m I profit, so I can explore that option.

The price stops me out and I ended my day in 9 minutes of trading. Now you have another technique under your personal trading armor.

Juan Fernando Vega

Mechanical Engineer

Bogota-Colombia

Spanish – Support

Skype: juanvegam


August 16-21 – Emini Nasdaq (NQ)

Trading Insights
featured image

There are 4 techniques defined to use when you trade with our software.

  • Buy or Sell above or below the 120 EMA, when you have a white or a blue dot (I use red and green dots in this setup)
  • Buy or Sell when a candle closes over the 120 EMA
  • Buy or sell on a stablished defined timestamp using the candle closed over the line the dot prints.

In this article I use Warp (Predictive software) to explain the last one that is what I did today. We also don’t have major news, its Monday and the last week of the summer season.

If you read my articles remember that I defined a setup to have more space between the predictive signals. At the New York session open, my first signal is at 8:29 over the 120 EMA and for the Nasdaq I like to trade after the 8:33 minute, just to see how the price action reacts. So, I wait until the next signal that is at 8:45. That signal tell me to buy, but the candles before the timestamp (8:45) are making lower lows. The candle at 8:46, the white one, did not close above the last candle also.

I’m a little bit cassius, draw a trendline above the candles, trying to find a breakout of it. The price crosses the 120 EMA, and appears my first opportunity to go short. But I used the predefined signal at 8:45, to wait the puncture of that level. What it means is that I am waiting a candle that going down closes under that level. When that happens, I open my trade and go short.

My daily goal is $500 usd, I draw a yellow line from my entry point that has 30 ticks of distance that’s $600 usd for one contract of the Nasdaq

When the price reaches that level, I move my stop loss tight to the active candle, and in the pullback, it stops me out, for a $575 usd profit target

The same puncture technique could be used at the 9:06 line, that’s the entry 2, with a 51 ticks profit move until the next signal 9:21am

Hope this article helps you to understand the puncture technique.

Juan Fernando Vega

Mechanical Engineer

Bogota-Colombia

Spanish - Support


August 12-21 – Emini Nasdaq (NQ)

Trading Insights
featured image

When i tell to the people that i trade the Emini Nasdaq in 1 minute chart, they used to say: “You are crazy” or “its to fast for me”

They didn't realize that are other intelligent ways to have a good lower risk with data mining. Warp is the software the allow me to achieve that task. Take a look.

Today was an special day, a lot of news that may you think: “Stay aware” of the volatility or just reduce your positions.

For risk management all is valid as long protect and preserve your capital. But when i trade the Nasdaq i open positions with 4 contracts, the size of my account allow me to do that.

At my predictive time stamp for today I have a sell signal at 8:31 am and at 9:00 am.

I just trigger the bottom at those times when the candle closes at the timeframe of 1 minute

Both trades gave me 57, 5 ticks x $20usd = $1.150 usd

My daily goal is of $500 so, 34 minutes of trading was enough for me. I like to watch the market sometimes until 11:00 am and today the market ends for me like this: 101 ticks from 8:30 am to 11:00 am for $2,030 usd.

All markets are predictable including Nasdaq with this technique; using Warp software (Data Mining – Predictive signals)

Juan Fernando Vega

Mechanical Engineer

Bogota-Colombia

Spanish - Support


August 5-2021 – Emini Dow Jones (YM)

Trading Insights
featured image

I love Dow Jones with his long moves and personality. My new setup allows me to see more distance between the dots, to avoid “noise” between them.

I trade at 8:30 for the opening bell for the New York session, and some times I like to open a position before the opening bell. Only with this instrument I do that.

Today the news has already happened, I am 1 hour late, so I open my first trade. I saw my first stamp time signal at 8:25 and decide to enter long.

I cover my first contract, and the second contract stops me out at the break even point. I decided to open a second trade after i get stop out, fast and cover the new first new contract, when I saw this big candle. At that moment both contracts are at the break even point. I let the second one runs and close it at 8:35

I change to a new chart, I alternate between them in one i have a swing of 8 and in the other a swing of 15, thats why you see different time stamps between the images. And le the trade ends at 8:43

Now I wait until 8:54. I open my trird trade, with 2 contracts and close it at 9:06 the first one.

When the candle closes at that time stamp y move my stop loss under the candle and the next candle stops me out

This day I made with the Dow Jones 98 Ticks @ $5 = $490 usd in 35 minutes of time

Juan Fernando Vega

Mechanical Engineer

Bogota-Colombia

Spanish - Support